I've created this plot using Seaborn and a pandas dataframe (data):

My code:
g = sns.lmplot('credibility', 'percentWatched', data=data, hue = 'millennial', markers = ["+", "."], x_jitter = True, y_jitter = True, size=5)
g.set(xlabel = 'Credibility Ranking\n ← Low       High  →', ylabel = 'Percent of Video Watched [%]')
You may notice the plot's legend title is simply the variable name ('millennial') and the legend items are the variable's values (0, 1). How can I edit the legend's title and labels? Ideally, the legend's title would be 'Generation' and the labels would be "Millennial" and "Older Generations"
- If
legend_out is set to True then legend is available through the g._legend property and it is a part of a figure. Seaborn legend is standard matplotlib legend object. Therefore you may change legend texts.
- Tested in
python 3.8.11, matplotlib 3.4.3, seaborn 0.11.2
import seaborn as sns
# load the tips dataset
tips = sns.load_dataset("tips")
# plot
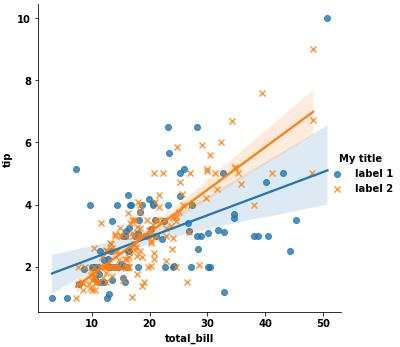
g = sns.lmplot(x="total_bill", y="tip", hue="smoker", data=tips, markers=["o", "x"], facet_kws={'legend_out': True})
# title
new_title = 'My title'
g._legend.set_title(new_title)
# replace labels
new_labels = ['label 1', 'label 2']
for t, l in zip(g._legend.texts, new_labels):
t.set_text(l)
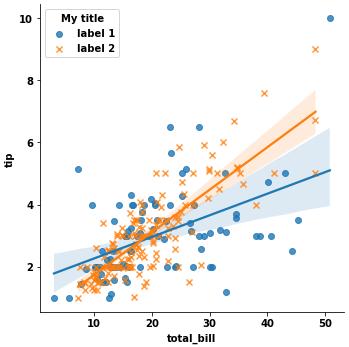
Another situation if legend_out is set to False. You have to define which axes has a legend (in below example this is axis number 0):
g = sns.lmplot(x="total_bill", y="tip", hue="smoker", data=tips, markers=["o", "x"], facet_kws={'legend_out': False})

# check axes and find which is have legend
leg = g.axes.flat[0].get_legend()
new_title = 'My title'
leg.set_title(new_title)
new_labels = ['label 1', 'label 2']
for t, l in zip(leg.texts, new_labels):
    t.set_text(l)
Moreover you may combine both situations and use this code:
g = sns.lmplot(x="total_bill", y="tip", hue="smoker", data=tips, markers=["o", "x"], facet_kws={'legend_out': True})

# check axes and find which is have legend
for ax in g.axes.flat:
    leg = g.axes.flat[0].get_legend()
    if not leg is None: break
# or legend may be on a figure
if leg is None: leg = g._legend

# change legend texts
new_title = 'My title'
leg.set_title(new_title)
new_labels = ['label 1', 'label 2']
for t, l in zip(leg.texts, new_labels):
    t.set_text(l)
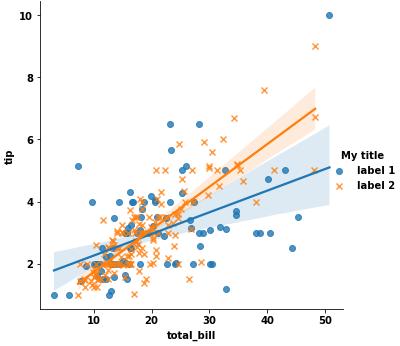
This code works for any seaborn plot which is based on Grid class.


 已为社区贡献126440条内容

所有评论(0)