

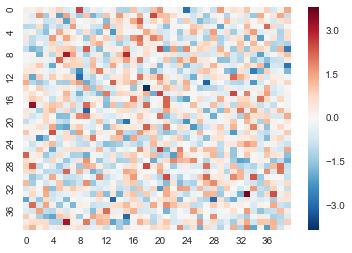
I'm plotting a heatmap in Seaborn. The problem is that I have too many squares in my plot so the x and y labels are too close to each other to be useful. So I'm creating a list of xticks and yticks to use. However passing this list to the function rotates the labels in the plot. It would be really nice to have seaborn automatically drop some of the ticks, but barring that I would like to be able to have the yticks upright.
import pandas as pd
import numpy as np
import seaborn as sns
data = pd.DataFrame(np.random.normal(size=40*40).reshape(40,40))
yticks = data.index
keptticks = yticks[::int(len(yticks)/10)]
yticks = ['' for y in yticks]
yticks[::int(len(yticks)/10)] = keptticks
xticks = data.columns
keptticks = xticks[::int(len(xticks)/10)]
xticks = ['' for y in xticks]
xticks[::int(len(xticks)/10)] = keptticks
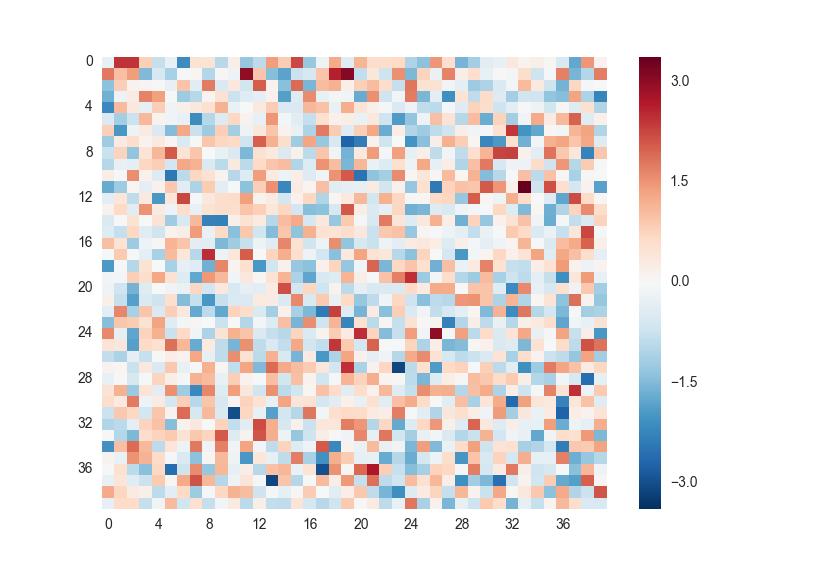
sns.heatmap(data,linewidth=0,yticklabels=yticks,xticklabels=xticks)


 已为社区贡献126445条内容

所有评论(0)