I know how to cycle through a list of colors in matplotlib. But is it possible to do something similar with line styles (plain, dotted, dashed, etc.)? I'd need to do that so my graphs would be easier to read when printed. Any suggestions how to do that?
Can i cycle through line styles in matplotlib
·
Answer a question
Answers
Something like this might do the trick:
import matplotlib.pyplot as plt
from itertools import cycle
lines = ["-","--","-.",":"]
linecycler = cycle(lines)
plt.figure()
for i in range(10):
    x = range(i,i+10)
    plt.plot(range(10),x,next(linecycler))
plt.show()
Result: 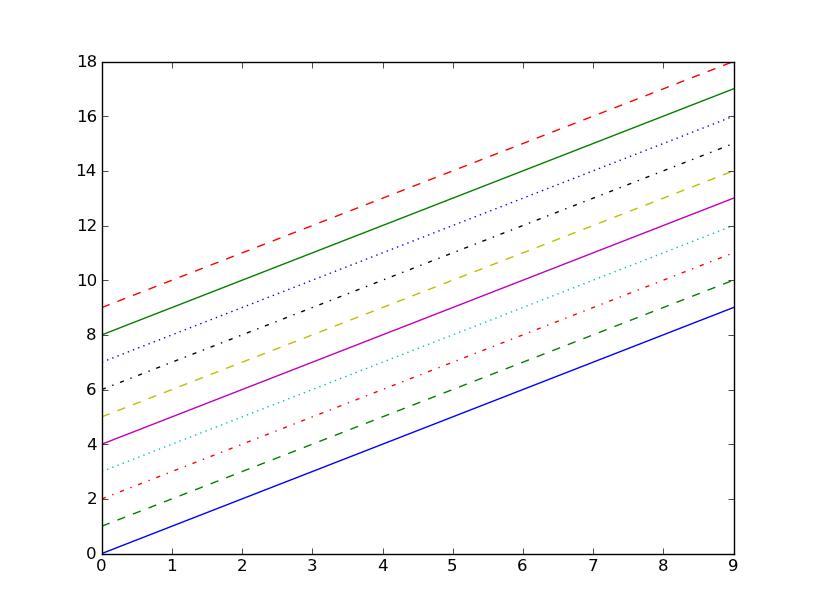
Edit for newer version (v2.22)
import matplotlib.pyplot as plt
from cycler import cycler
#
plt.figure()
for i in range(5):
    x = range(i,i+5)
    linestyle_cycler = cycler('linestyle',['-','--',':','-.'])
    plt.rc('axes', prop_cycle=linestyle_cycler)
    plt.plot(range(5),x)
    plt.legend(['first','second','third','fourth','fifth'], loc='upper left', fancybox=True, shadow=True)
plt.show()
For more detailed information consult the matplotlib tutorial on "Styling with cycler"
To see the output click "show figure"

Python社区为您提供最前沿的新闻资讯和知识内容
更多推荐

 0
0 0
0- 0


 已为社区贡献126440条内容

所有评论(0)