

preface
Using Python to realize the visualization of China Metro data. No more nonsense.
Let's start happily~
development tool
Python version: 3.6.4
Related modules:
requests module;
wordcloud module;
pandas module;
numpy module;
jieba module;
Pyecarts module;
matplotlib module;
And some Python built-in modules.
Environment construction
Many people learn Python and don't know where to start.

Many people learn to find python,After mastering the basic grammar, I don't know where to start.

Many people who may already know the case do not learn more advanced knowledge.

For these three types of people, I provide you with a good learning platform, free access to video tutorials, e-books, and the source code of the course!

QQ Group:101677771

Welcome to join us and discuss and study together
Install Python and add it to the environment variable. pip can install the relevant modules required.
This time, through the acquisition of subway line data, the urban distribution data are visually analyzed.
Analysis acquisition
Metro information is obtained from Gaode map.
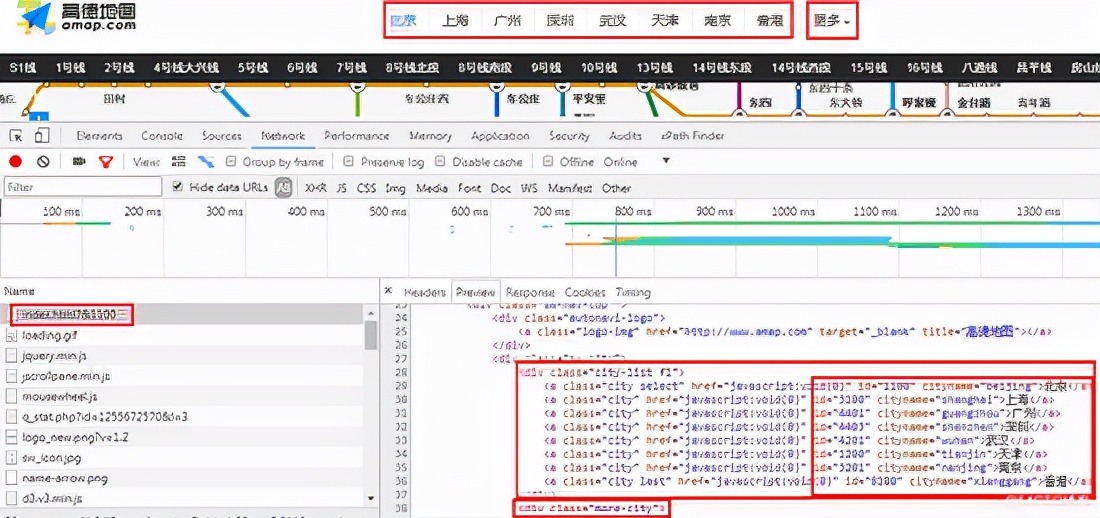
The above mainly obtains the "id", "cityname" and "name" of the city.
It is used to splice the request website to obtain the specific information of the subway line.
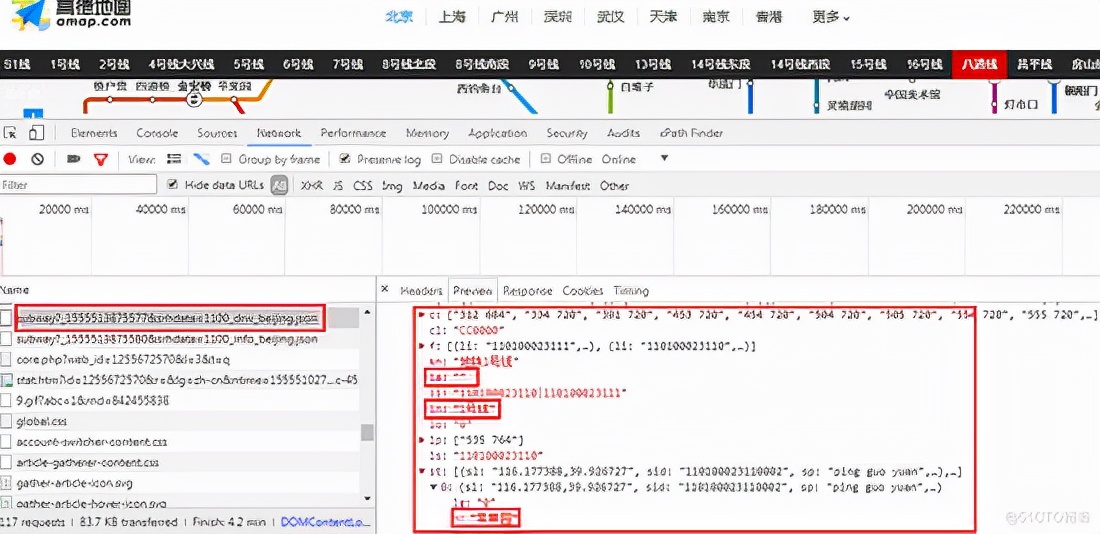
Find the request information and get the details of subway lines and stations in the lines in each city.
get data
Specific code
import json
import requests
from bs4 import BeautifulSoup

headers = {'user-agent': 'Mozilla/5.0 (Windows NT 6.1; WOW64) AppleWebKit/537.36 (KHTML, like Gecko) Chrome/63.0.3239.132 Safari/537.36'}

def get_message(ID, cityname, name):
    """
    Metro line information acquisition
    """
    url = 'http://map.amap.com/service/subway?_1555502190153&srhdata=' + ID + '_drw_' + cityname + '.json'
    response = requests.get(url=url, headers=headers)
    html = response.text
    result = json.loads(html)
    for i in result['l']:
        for j in i['st']:
            # Judge whether the subway line is included
            if len(i['la']) > 0:
                print(name, i['ln'] + '(' + i['la'] + ')', j['n'])
                with open('subway.csv', 'a+', encoding='gbk') as f:
                    f.write(name + ',' + i['ln'] + '(' + i['la'] + ')' + ',' + j['n'] + '\n')
            else:
                print(name, i['ln'], j['n'])
                with open('subway.csv', 'a+', encoding='gbk') as f:
                    f.write(name + ',' + i['ln'] + ',' + j['n'] + '\n')

def get_city():
    """
    Urban information acquisition
    """
    url = 'http://map.amap.com/subway/index.html?&1100'
    response = requests.get(url=url, headers=headers)
    html = response.text
    # code
    html = html.encode('ISO-8859-1')
    html = html.decode('utf-8')
    soup = BeautifulSoup(html, 'lxml')
    # City list
    res1 = soup.find_all(class_="city-list fl")[0]
    res2 = soup.find_all(class_="more-city-list")[0]
    for i in res1.find_all('a'):
        # City ID value
        ID = i['id']
        # City Pinyin name
        cityname = i['cityname']
        # City name
        name = i.get_text()
        get_message(ID, cityname, name)
    for i in res2.find_all('a'):
        # City ID value
        ID = i['id']
        # City Pinyin name
        cityname = i['cityname']
        # City name
        name = i.get_text()
        get_message(ID, cityname, name)

if __name__ == '__main__':
    get_city()
Display of data acquisition results
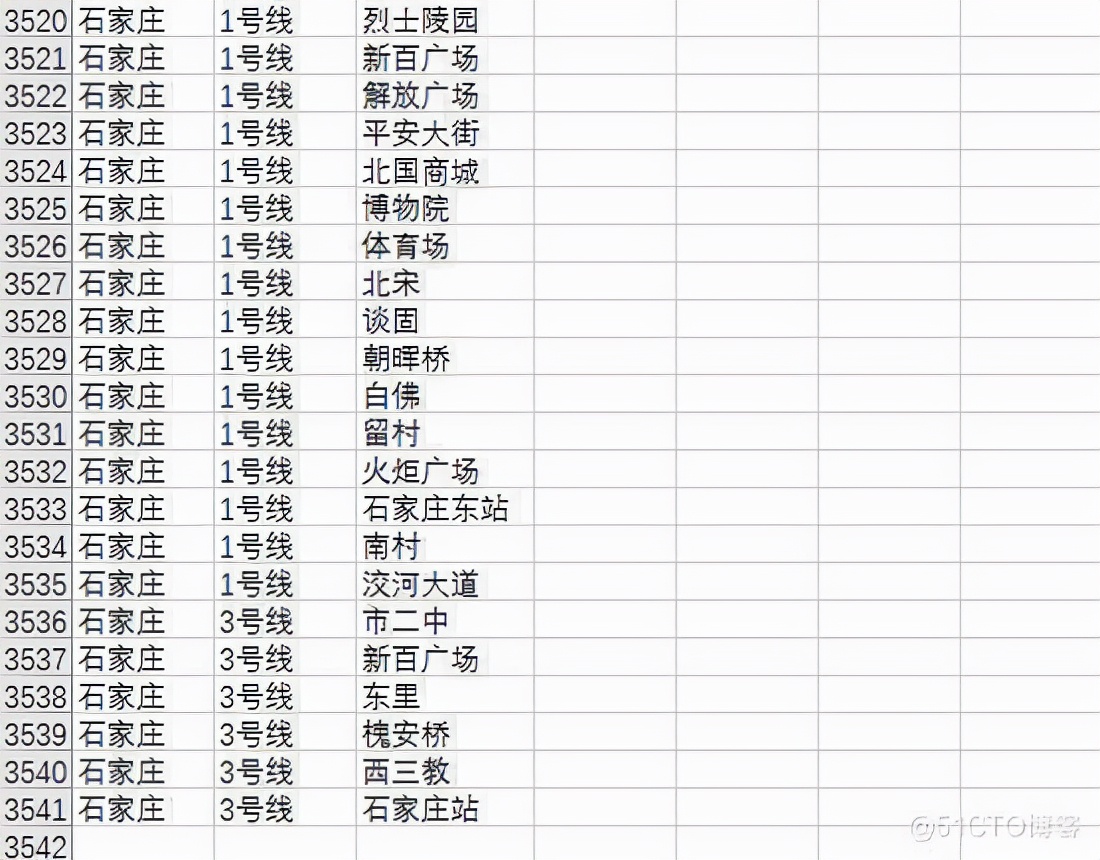
3541 subway stations
Data visualization
Firstly, clean the data to remove the duplicate transfer station information.
from wordcloud import WordCloud, ImageColorGenerator
from pyecharts import Line, Bar
import matplotlib.pyplot as plt
import pandas as pd
import numpy as np
import jieba

# Set column name to align with data
pd.set_option('display.unicode.ambiguous_as_wide', True)
pd.set_option('display.unicode.east_asian_width', True)
# Show 10 lines
pd.set_option('display.max_rows', 10)
# Read data
df = pd.read_csv('subway.csv', header=None, names=['city', 'line', 'station'], encoding='gbk')
# Subway lines in various cities
df_line = df.groupby(['city', 'line']).count().reset_index()
print(df_line)
By grouping cities and subway lines, the total number of subway lines in China is obtained.
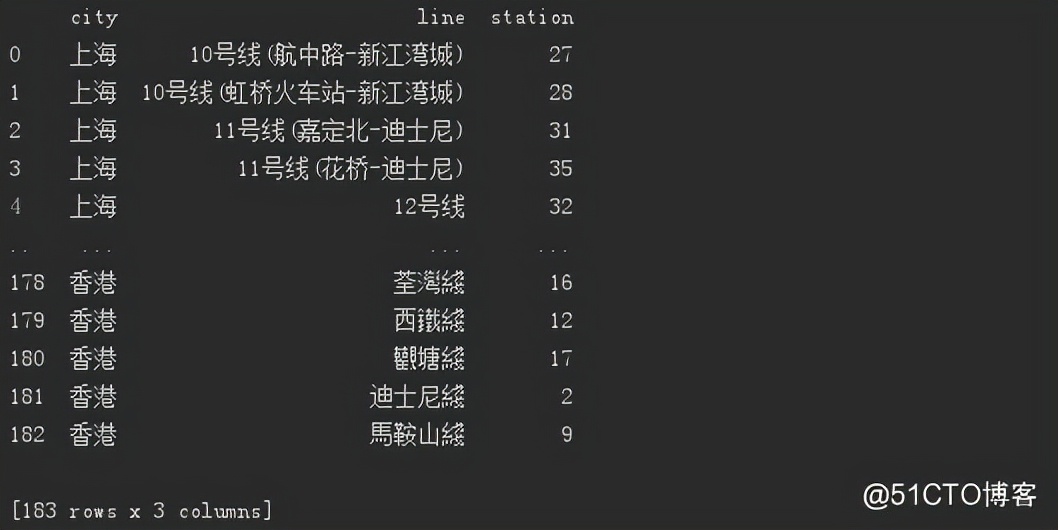
183 subway lines
def create_map(df):
    # draw a map
    value = [i for i in df['line']]
    attr = [i for i in df['city']]
    geo = Geo("Distribution of opened metro cities", title_pos='center', title_top='0', width=800, height=400, title_color="#fff", background_color="#404a59", )
    geo.add("", attr, value, is_visualmap=True, visual_range=[0, 25], visual_text_color="#fff", symbol_size=15)
    geo.render("Distribution of opened metro cities.html")

def create_line(df):
    """
    Number and distribution of generated urban subway lines
    """
    title_len = df['line']
    bins = [0, 5, 10, 15, 20, 25]
    level = ['0-5', '5-10', '10-15', '15-20', '20 above']
    len_stage = pd.cut(title_len, bins=bins, labels=level).value_counts().sort_index()
    # Generate histogram
    attr = len_stage.index
    v1 = len_stage.values
    bar = Bar("Number and distribution of subway lines in each city", title_pos='center', title_top='18', width=800, height=400)
    bar.add("", attr, v1, is_stack=True, is_label_show=True)
    bar.render("Number and distribution of subway lines in each city.html")

# Number of subway lines in each city
df_city = df_line.groupby(['city']).count().reset_index().sort_values(by='line', ascending=False)
print(df_city)
create_map(df_city)
create_line(df_city)
Data of cities that have opened subway, as well as the number of subway lines in each city.
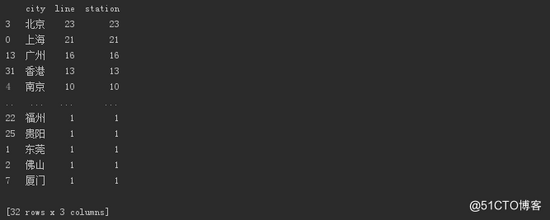
Subways opened in 32 cities
Urban distribution

Most of them are provincial capitals, as well as some cities with strong economic strength.
Number and distribution of lines
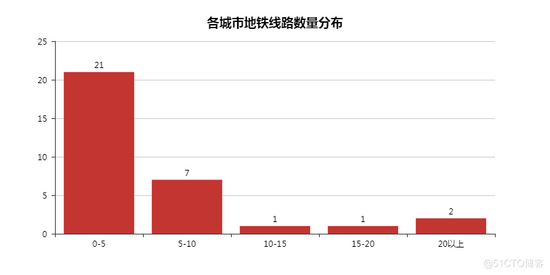
It can be seen that most of them are still in the "0-5" stage, of course, at least 1 line.
# Which line has the most subway stations in which city
print(df_line.sort_values(by='station', ascending=False))
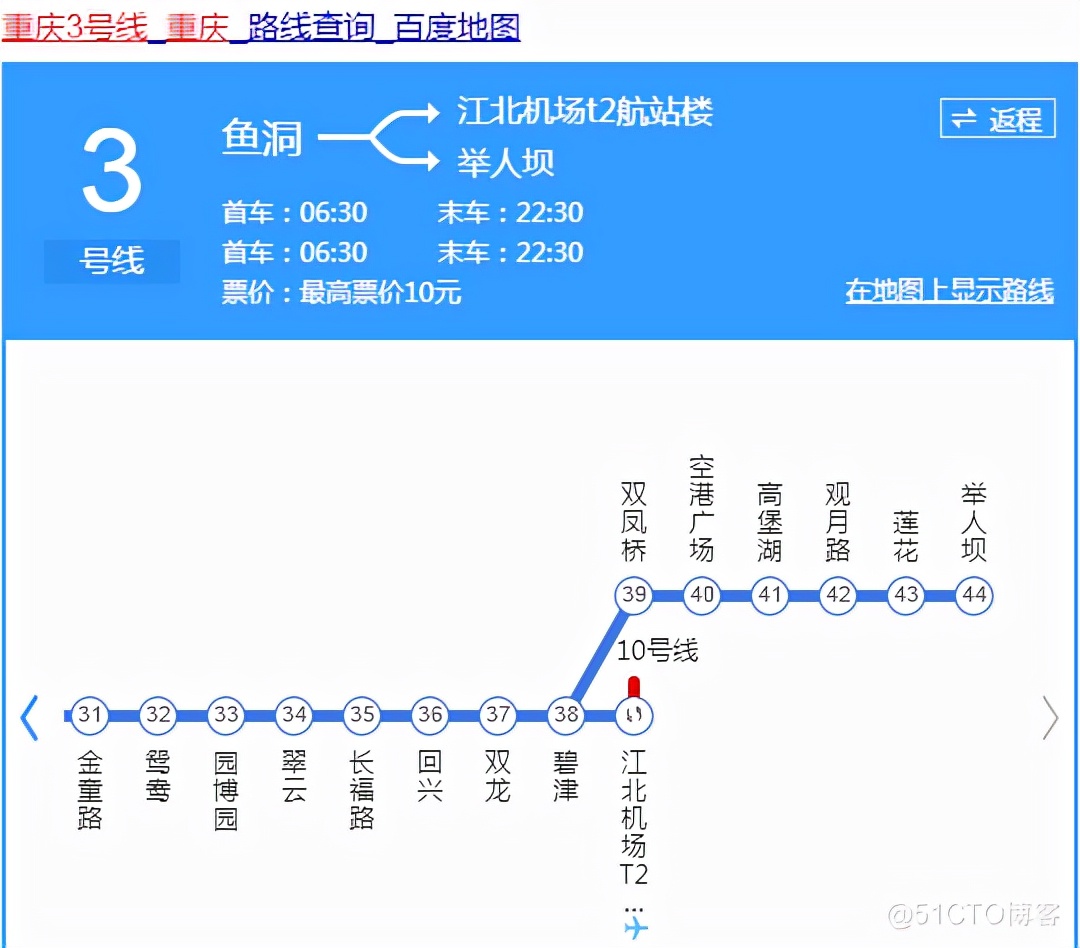
Which line has the most subway stations in which city
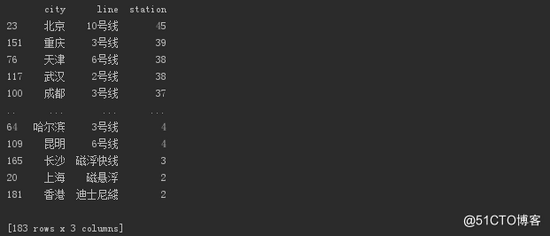
Beijing line 10 is the first and Chongqing line 3 is the second
Remove data from duplicate transfer stations
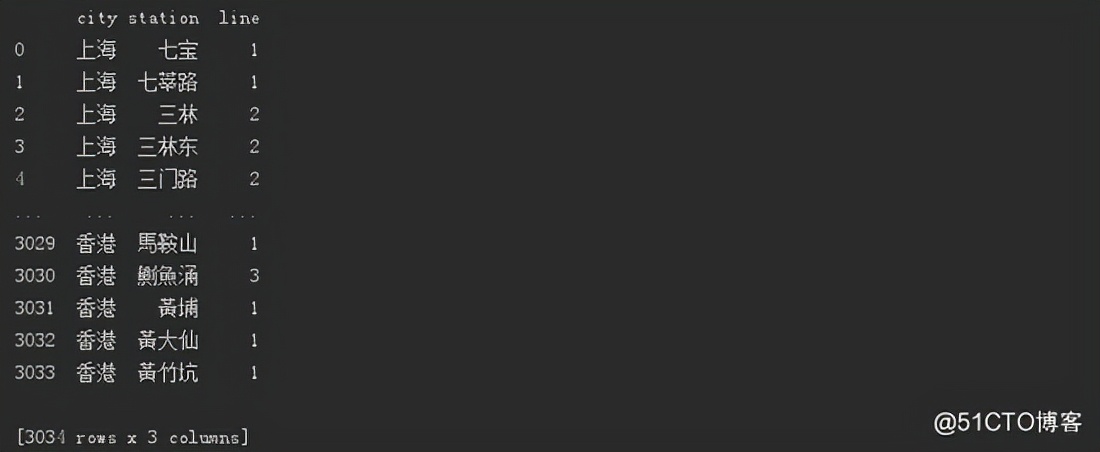
# Remove subway data from duplicate transfer stations
df_station = df.groupby(['city', 'station']).count().reset_index()
print(df_station)
Including 3034 subway stations
Nearly 400 subway stations have been reduced
Next, let's see which city has the most subway stations
# Count the number of subway stations included in each city (duplicate transfer stations have been removed)
print(df_station.groupby(['city']).count().reset_index().sort_values(by='station', ascending=False))
There are so many subway stations in Wuhan

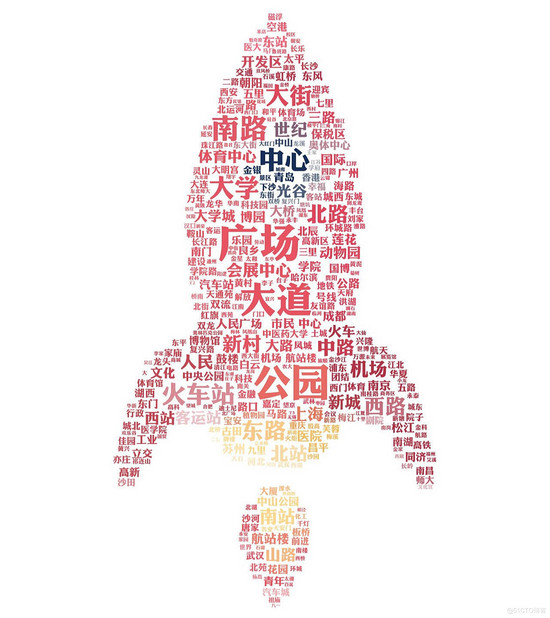
Realize the operation in the new weekly to generate the subway noun cloud
def create_wordcloud(df):
    """
    Generate Metro noun cloud
    """
    # participle
    text = ''
    for line in df['station']:
        text += ' '.join(jieba.cut(line, cut_all=False))
        text += ' '
    backgroud_Image = plt.imread('rocket.jpg')
    wc = WordCloud(
        background_color='white',
        mask=backgroud_Image,
        font_path='C:\Windows\Fonts\Huakangli Gold Black W8.TTF',
        max_words=1000,
        max_font_size=150,
        min_font_size=15,
        prefer_horizontal=1,
        random_state=50,
    )
    wc.generate_from_text(text)
    img_colors = ImageColorGenerator(backgroud_Image)
    wc.recolor(color_func=img_colors)
    # Look at those with high word frequency
    process_word = WordCloud.process_text(wc, text)
    sort = sorted(process_word.items(), key=lambda e: e[1], reverse=True)
    print(sort[:50])
    plt.imshow(wc)
    plt.axis('off')
    wc.to_file("Subway noun cloud.jpg")
    print('Word cloud generated successfully!')

create_wordcloud(df_station)
Show word cloud


 已为社区贡献126445条内容

所有评论(0)