
如何在 AWS Lambda 中使用 OpenTelemetry
Lambda是用于无服务器功能的 AWS 解决方案。
OpenTelemetry是一个开源项目,旨在创建跟踪并将其发送到后端并获得可见性。
具有可观察性的开发人员将无服务器 lambda 作为其堆栈的一部分,肯定会解决将 OpenTelemetry 与 lambda 连接的需求。
如果您是这样的开发人员,那么本指南适合您。
今天,我将向您展示如何使用 OpenTelemetry 部署启用跟踪的 lambda。
本文是AspectoHello World 系列的一部分,我们在其中为您解决与分布式服务相关的主题。我们的团队在网上搜索常见问题,然后我们自己解决这些问题并为您提供完整的操作指南。 Aspecto 是一个基于 OpenTelemetry 的分布式跟踪平台,适用于分布式应用程序的开发人员和团队。
设置
为您的项目创建一个新目录,并添加以下 package.json(或此包到您现有的项目):
{
 "name": "lambda-otel-post",
 "version": "1.0.0",
 "description": "",
 "main": "handler.js",
 "dependencies": {
   "@opentelemetry/api": "1.0.2",
   "@opentelemetry/instrumentation": "0.25.0",
   "@opentelemetry/auto-instrumentations-node": "0.25.0",
   "@opentelemetry/instrumentation-aws-lambda": "0.25.0",
   "@opentelemetry/instrumentation-http": "0.25.0",
   "@opentelemetry/sdk-trace-base": "0.25.0",
   "@opentelemetry/sdk-trace-node": "0.25.0",
   "axios": "^0.24.0"
 },
 "devDependencies": {},
 "scripts": {
   "test": "echo \"Error: no test specified\" && exit 1"
 },
 "author": "",
 "license": "ISC"
}
进入全屏模式 退出全屏模式
运行安装:
npm install
进入全屏模式 退出全屏模式
添加handler.js
此代码是一个简单的 lambda 入口点,其中包含对外部 API 的调用并返回一条消息。
稍后,我们将要确保已经为这个 HTTP 调用以及实际的 lambda 调用创建了一个 span。
'use strict';

const axios = require("axios");

module.exports.hello = async (event) => {
 const todoItem = await axios('https://jsonplaceholder.typicode.com/todos/1');

 return {
   statusCode: 200,
   body: JSON.stringify(
     {
       message: 'Some Message Here',
       input: event,
     },
     null,
     2
   ),
 };

 // Use this code if you don't use the http event with the LAMBDA-PROXY integration
 // return { message: 'Go Serverless v1.0! Your function executed successfully!', event };
};
进入全屏模式 退出全屏模式
添加启用 OpenTelemetry 跟踪的 lambda 包装文件
让我们添加以下 lambda-wrapper.js 文件:
const { SimpleSpanProcessor, ConsoleSpanExporter } = require("@opentelemetry/sdk-trace-base");
const { NodeTracerProvider } = require('@opentelemetry/sdk-trace-node');
const { AwsLambdaInstrumentation } = require('@opentelemetry/instrumentation-aws-lambda');
const { registerInstrumentations } = require('@opentelemetry/instrumentation');
const { getNodeAutoInstrumentations } = require("@opentelemetry/auto-instrumentations-node");

const provider = new NodeTracerProvider();
provider.addSpanProcessor(new SimpleSpanProcessor(new ConsoleSpanExporter()))
provider.register();

registerInstrumentations({
 instrumentations: [
   getNodeAutoInstrumentations(),
   new AwsLambdaInstrumentation({
     disableAwsContextPropagation: true
   })
 ],
});
进入全屏模式 退出全屏模式
请注意,我使用的是ConsoleSpanExporter,它将所有遥测数据写入控制台。
在生产中,您可能希望将其发送到其他工具,例如Jaeger或可观察性供应商。
但是,对于这篇博文,这个导出器可以。
关于disableAwsContextPropagation的注释
您可能想知道的另一件事是为什么我添加了disableAwsContextPropagation:true。
原因是 lambda 检测默认尝试使用X-Ray上下文标头(即使我们不使用 X-Ray),导致我们有一个非采样上下文和一个NonRecordingSpan。
为了解决这个问题,我们使用disableAwsContextPropagation标志。
有关这方面的更多信息,请参见此处的和仪器文档。
部署 lambda
将 lambda 部署到 S3 有多种方法,这不是本教程的范围。
我选择使用无服务器框架,但您也可以使用 AWS CLI / 其他形式来执行此操作。
如果您使用无服务器,这是 serverless.yml 文件。
不要忘记设置正确的区域和函数名称。
service: lambda-otel-post

# You can pin your service to only deploy with a specific Serverless version
# Check out our docs for more details
frameworkVersion: '2'

provider:
 name: aws
 runtime: nodejs12.x
 lambdaHashingVersion: 20201221
 environment:
   NODE_OPTIONS: --require lambda-wrapper


 region: eu-west-2

functions:
 tom-otel-lambda-post:
   handler: handler.hello
进入全屏模式 退出全屏模式
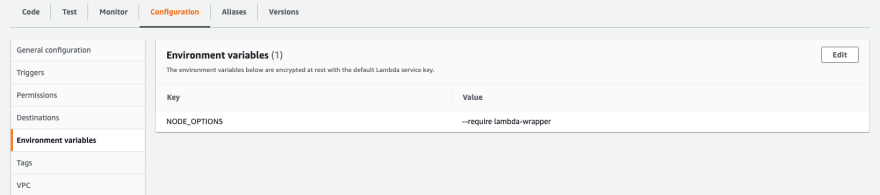
添加环境变量
为了运行跟踪代码,我们需要确保 Node 在需要任何其他文件之前需要它。
这就是为什么我们需要为 NODE_OPTIONS 环境变量添加这个值:“–require lambda-wrapper”。
如果您对上述文件使用无服务器,它会自动为您完成。
如果没有,请前往已部署 lambda 的配置部分并进行设置:
[ ](https://res.cloudinary.com/practicaldev/image/fetch/s--_x0SZwvp--/c_limit%2Cf_auto%2Cfl_progressive%2Cq_auto%2Cw_880/https:// dev-to-uploads.s3.amazonaws.com/uploads/articles/dcvzuzz0gdhg5o3uakwz.png)
这种必要性的原因是包装文件必须在任何其他文件之前包含,以便 OpenTelemetry 仪器正常工作。
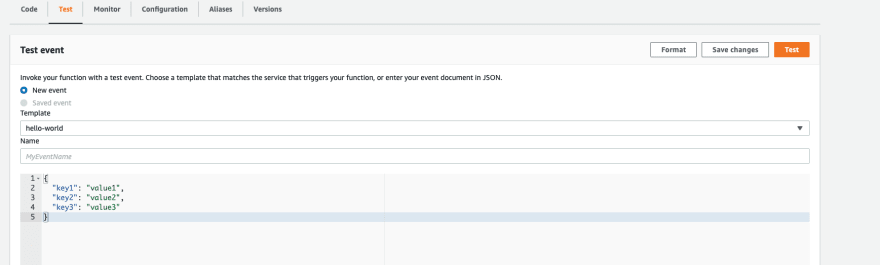
调用lambda函数
现在,当您运行 lambda(我使用内置 AWS 控制台的测试实用程序)时,您应该会看到创建了 2 个跨度——一个用于 lambda 调用,另一个用于传出 HTTP 调用。
[ ](https://res.cloudinary.com/practicaldev/image/fetch/s--_6tvyBHx--/c_limit%2Cf_auto%2Cfl_progressive%2Cq_auto%2Cw_880/https ://dev-to-uploads.s3.amazonaws.com/uploads/articles/xa135ifguf6w0ogqbgar.png)
确实,这就是我们得到的:
这是传出的 HTTP 跨度
{
  traceId: '4f373b61315c23fa47605a72b94ab59e',
  parentId: '7ce4ab2283755eda',
  name: 'HTTPS GET',
  id: '54c07955525dad7f',
  kind: 2,
  timestamp: 1635332193754154,
  duration: 82864,
  attributes: {
    'http.url': 'https://jsonplaceholder.typicode.com/todos/1',
    'http.method': 'GET',
    'http.target': '/todos/1',
    'net.peer.name': 'jsonplaceholder.typicode.com',
    'net.peer.ip': '104.21.4.48',
    'net.peer.port': 443,
    'http.host': 'jsonplaceholder.typicode.com:443',
    'http.response_content_length_uncompressed': 83,
    'http.status_code': 200,
    'http.status_text': 'OK',
    'http.flavor': '1.1',
    'net.transport': 'ip_tcp'
  },
  status: { code: 1 },
  events: []
}
进入全屏模式 退出全屏模式
和 lambda 调用跨度:
{
  traceId: '4f373b61315c23fa47605a72b94ab59e',
  parentId: undefined,
  name: 'lambda-otel-post-dev-tom-otel-lambda-post',
  id: '7ce4ab2283755eda',
  kind: 1,
  timestamp: 1635332193747990,
  duration: 93019,
  attributes: {
    'faas.execution': 'ed075caa-4d54-44f8-96b4-b96085acbf9a',
    'faas.id': 'arn:aws:lambda:eu-west-2:MY-AWS-ID:function:lambda-otel-post-dev-tom-otel-lambda-post',
    'cloud.account.id': 'MY-AWS-ID'
  },
  status: { code: 0 },
  events: []
}
进入全屏模式 退出全屏模式
对于今天的人们来说就是这样,您现在可以将这些跨度导出到您喜欢的任何地方。
附言如果您还没有一种简单的方法来可视化这些痕迹,请随时查看Aspecto(它是免费的)。这是单个跟踪的样子:
[ ](https://res.cloudinary.com/practicaldev/image/fetch/s--61Z475GA--/c_limit%2Cf_auto%2Cfl_progressive%2Cq_auto%2Cw_880/https:// /dev-to-uploads.s3.amazonaws.com/uploads/articles/e174usakq3tm1sqpc3s3.png)

ModelScope旨在打造下一代开源的模型即服务共享平台,为泛AI开发者提供灵活、易用、低成本的一站式模型服务产品,让模型应用更简单!
更多推荐
 0
0 0
0- 0


 已为社区贡献27134条内容

所有评论(0)