prometheus监控K8S
本文采用helm安装Prometheus+Grafana配置alertmanager及告警规则实现邮件报警。# helm仓库 grafana: https://grafana.github.io/helm-chartsprometheus-community: https://prometheus-community.github.io/helm-charts # chart包 grafana/g
一、概述
本文采用helm安装Prometheus+Grafana
配置alertmanager及告警规则实现邮件报警。
其中所采用的helm仓库及chart包如下所示:
# helm仓库
grafana: https://grafana.github.io/helm-charts
prometheus-community: https://prometheus-community.github.io/helm-charts

# chart包
grafana/grafana
prometheus-community/prometheus
二、准备工作
安装helm
项目地址:https://github.com/helm/helm
安装:
[root@master01]# wget https://get.helm.sh/helm-v3.8.1-linux-amd64.tar.gz   # 下载(自行选择版本)
[root@master01]# tar zxvf helm-v3.8.1-linux-amd64.tar.gz   # 解压
[root@master01]# mv linux-amd64/helm /usr/local/bin/   # 安装
[root@master01]# helm version  # 验证
删除Helm使用时关于kubernetes文件的警告
chmod g-rw ~/.kube/config
chmod o-r ~/.kube/config
chart包下载
# 添加grafana和prometheus-community仓库(无响应时多尝试几次)
[root@master01]# helm repo add grafana https://grafana.github.io/helm-charts
[root@master01]# helm repo add prometheus-community https://prometheus-community.github.io/helm-charts
[root@master01]# helm repo update   # 更新仓库
[root@master01]# helm search repo grafana  # 查询chart
[root@master01]# mkdir -p ~/workspace/prometheus  # 创建工作目录
[root@master01]# cd ~/workspace/prometheus  # 拉取所有的chart包(请放到相应的目录中)
helm pull grafana/grafana
helm pull prometheus-community/prometheus
helm pull prometheus-community/prometheus-mysql-exporter
helm pull prometheus-community/prometheus-redis-exporter
helm pull prometheus-community/prometheus-kafka-exporter
helm pull prometheus-community/prometheus-rabbitmq-exporter
[root@node01 ~]# cd /root/workspace/prometheus/
tar zxvf [压缩包]            # 分别解压
镜像同步
prometheus内嵌kube-state-metrics安装包,其使用的是gcr镜像,也是所有chart包中唯一的gcr镜像,可能会导致镜像拉取失败,因此有必要提前同步该镜像
编辑配置文件
已同步到个人阿里云镜像仓库
[root@master01 prometheus]# cd prometheus
[root@master01 prometheus]# vim charts/kube-state-metrics/values.yaml
# Default values for kube-state-metrics.
prometheusScrape: true
image:
  repository: registry.cn-zhangjiakou.aliyuncs.com/gcr-sync/kube-state-metrics
  tag: v2.3.0
  pullPolicy: IfNotPresent
安装Prometheus
进入工作目录,按需修改镜像,持久化存储,副本数等配置;
建议首次部署时直接修改values中的配置,而不是用–set的方式,这样后期upgrade不必重复设置。
[root@master01 prometheus]# cd  ~/workspace/promethues/promethues
[root@master01 prometheus]# vim values.yaml
设置持久化存储
若无需持久化,将enabled设置为false
若使用文件存储,需将accessMode改为ReadWriteMany
storageClass的创建请参考之前的文章
/persistentVolume   # 搜索持久化设置,VIM界面按Esc后输入(再按n搜索下一个):
  persistentVolume:
   ## If true, alertmanager will create/use a Persistent Volume Claim
    ## If false, use emptyDir
    enabled: false
#总共有四处,分别为alertmanager,Prometheus server,persistentVolume,pushgateway。
#参考官方文档建议配置,本文仅开启Prometheus server的持久化,其它的关闭
  alertmanager:
  ## If false, alertmanager will not be installed
    enabled: true

      service:
      ## If false, no Service will be created for the Prometheus server
    enabled: true

pushgateway:
  ## If false, pushgateway will not be installed
  enabled: true

  ## Use an alternate scheduler, e.g. "stork".
  ## ref: https://kubernetes.io/docs/tasks/administer-cluster/configure-multiple-schedulers/
  ##
  # schedulerName:

  persistentVolume:
    ## If true, Prometheus server will create/use a Persistent Volume Claim
    ## If false, use emptyDir
    ##
    enabled: false

多副本
设置replicaCount为3,并开启statefulset
 ## Use a StatefulSet if replicaCount needs to be greater than 1 (see below)
  ##
  replicaCount: 3

  ## Annotations to be added to deployment
  ##
  deploymentAnnotations: {}

  statefulSet:
    ## If true, use a statefulset instead of a deployment for pod management.
    ## This allows to scale replicas to more than 1 pod
    ##
    enabled: true

开启NodePort
Alertmanager,更改ClusterIP为NodePort,并设置nodeport端口号。在370行左右
  service:
    annotations: {}
    labels: {}
    clusterIP: ""

    ## Enabling peer mesh service end points for enabling the HA alert manager
    ## Ref: https://github.com/prometheus/alertmanager/blob/master/README.md
    # enableMeshPeer : true

    ## List of IP addresses at which the alertmanager service is available
    ## Ref: https://kubernetes.io/docs/user-guide/services/#external-ips
    ##
    externalIPs: []

    loadBalancerIP: ""
    loadBalancerSourceRanges: []
    servicePort: 80
    nodePort: 30090
    sessionAffinity: None
    type: NodePort

Prometheus server,更改ClusterIP为NodePort,并新增nodeport字段。在1120行左右
  service:
    ## If false, no Service will be created for the Prometheus server
    ##
    enabled: true

    annotations: {}
    labels: {}
    clusterIP: ""

    ## List of IP addresses at which the Prometheus server service is available
    ## Ref: https://kubernetes.io/docs/user-guide/services/#external-ips
    ##
    externalIPs: []

    loadBalancerIP: ""
    loadBalancerSourceRanges: []
    servicePort: 80
    nodePort: 30091
    sessionAffinity: None
    type: NodePort
三、部署prometheus、grafana
[root@master01 prometheus]# kubectl create ns prometheus     # 创建命名空间
[root@master01 prometheus]# helm install prometheus -n prometheus .  # 确保是在工作目录:~/workspace/prometheus/prometheus,helm部署
部署完查看service,将会在grafana中配置数据源时用到
[root@master01 prometheus]# kubectl get svc -n prometheus
NAME                               TYPE        CLUSTER-IP     EXTERNAL-IP   PORT(S)          AGE
prometheus-alertmanager            NodePort    10.1.134.69   <none>        80:30529/TCP   103s
prometheus-alertmanager-headless   ClusterIP   None          <none>        80/TCP         103s
prometheus-kube-state-metrics      ClusterIP   10.1.44.240   <none>        8080/TCP       103s
prometheus-node-exporter           ClusterIP   10.1.102.38   <none>        9100/TCP       103s
prometheus-pushgateway             ClusterIP   10.1.66.116   <none>        9091/TCP       103s
prometheus-server                  NodePort    10.1.40.73    <none>        80:30091/TCP   103s
访问alertmanager-dashboard::30529
访问server-dashboard::30091
安装Grafana
同样安装在prometheus空间下
创建Secret
在prometheus命名空间下新建secret,帐号密码:admin / grafana
[root@master01 ]# cd ~/workspace/prometheus/grafana
[root@master01 grafana]# echo -n "admin" | base64
echo -n "grafana" | base64
[root@master01 grafana]# cat > secret.yaml  <<EOF
apiVersion: v1
kind: Secret
metadata:
  name: grafana
  namespace: prometheus
type: Opaque
data:
  admin-user: YWRtaW4=
  admin-password: Z3JhZmFuYQ==
EOF
[root@master01 grafana]# kubectl apply -f secret.yaml
chart包参数设置
进入工作目录,按需修改镜像,持久化存储,副本数等配置;
建议首次部署时直接修改values中的配置,而不是用–set的方式,这样后期upgrade不必重复设置。
[root@master01 grafana]# vim values.yaml
设置密码
# Administrator credentials when not using an existing secret (see below)
adminUser: admin
# adminPassword: strongpassword

# Use an existing secret for the admin user.
admin:
  ## Name of the secret. Can be templated.
  existingSecret: "grafana"     # 即之前创建的secret
  userKey: admin-user
  passwordKey: admin-password
设置持久化存储
若无需持久化,将enabled设置为false
若使用文件存储,需将accessMode改为ReadWriteMany

## Enable persistence using Persistent Volume Claims
## ref: http://kubernetes.io/docs/user-guide/persistent-volumes/
##
persistence:
  type: pvc
  enabled: false
  # storageClassName: default
  accessModes:
    - ReadWriteOnce
  size: 2Gi
  # annotations: {}
  finalizers:
    - kubernetes.io/pvc-protection
设置NodePort
更改ClusterIP为NodePort,并新增nodeport字段
## Expose the grafana service to be accessed from outside the cluster (LoadBalancer service).
## or access it from within the cluster (ClusterIP service). Set the service type and the port to serve it.
## ref: http://kubernetes.io/docs/user-guide/services/
##
service:
  enabled: true
  type: NodePort
  nodePort: 30092
  port: 80
  targetPort: 3000
    # targetPort: 4181 To be used with a proxy extraContainer
  ## Service annotations. Can be templated.
  annotations: {}
  labels: {}
  portName: service
四、设置grafana
[root@master01 grafana]# helm install grafana -n prometheus .
配置dashboard
登录grafana
访问grafana-dashboard::30092
帐号密码(之前自定义的secret): admin /grafana

配置Data sources
首先,获取prometheus的service地址
[root@master01 grafana]# kubectl get svc -n prometheus   # 查询svc
NAME                               TYPE        CLUSTER-IP     EXTERNAL-IP   PORT(S)        AGE
prometheus-server                  NodePort    10.1.40.73     <none>        80:30091/TCP   15m
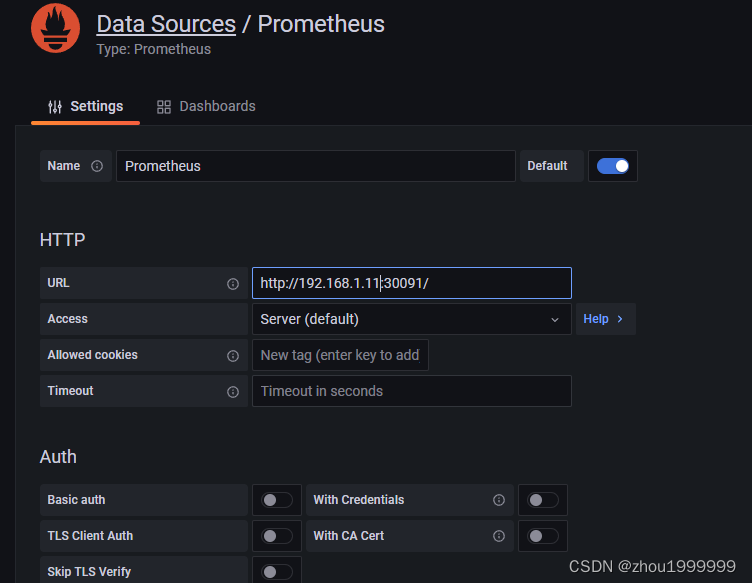
进入Data sources配置页面
添加Prometheus,URL填入prometheus的service的ip
在这里插入图片描述
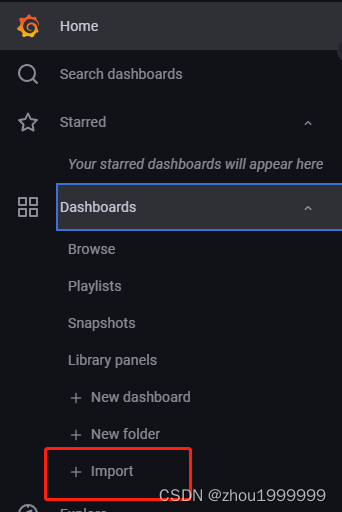
导入dashboard模版
Data sources配置完成后,导入模版
image-20210805203008361
导入模版:1 Node Exporter for Prometheus Dashboard CN v20191102(12377)
更多模版请参考官网网站:https://grafana.com/grafana/dashboards
数据源选择Prometheus,然后点击import
最终效果:

K8S/Kubernetes社区为您提供最前沿的新闻资讯和知识内容
更多推荐


 0
0 0
0- 0


 已为社区贡献8条内容

所有评论(0)