MongoDB 慢日志配置与管理指南
当前慢查询阈值: 500msProfiling 级别: 1(只记录慢操作)存储位置: system.profile 集合(每个数据库独立)日志查看: kubectl logs 或 system.profile 集合。
·
目录标题
MongoDB 慢日志配置与管理指南
一、当前环境配置信息
1.1 环境概览
- MongoDB版本: 5.0.26
- 命名空间: qfusion-hxl
- 实例: mongo-1ea38e80-shardsvr1
- 验证时间: 2025-08-27
1.2 慢日志当前配置
| 配置项 | 当前值 | 说明 |
|---|---|---|
| Profiling级别 | 1 | 只记录慢操作 |
| 慢查询阈值 | 500ms | 超过500毫秒的操作被记录 |
| 采样率 | 1.0 | 100%采样,所有慢操作都记录 |
| 存储位置 | system.profile集合 | MongoDB内置集合 |
| 日志输出 | 容器标准输出 | 通过kubectl logs查看 |
二、MongoDB 慢日志机制详解
2.1 Profiling 级别说明
| 级别 | 值 | 说明 | 使用场景 |
|---|---|---|---|
| 关闭 | 0 | 不记录任何操作 | 生产环境默认 |
| 慢操作 | 1 | 只记录慢操作 | 性能调优常用 |
| 全部 | 2 | 记录所有操作 | 开发调试使用 |
2.2 慢日志存储方式
MongoDB 提供两种慢日志存储方式:
-
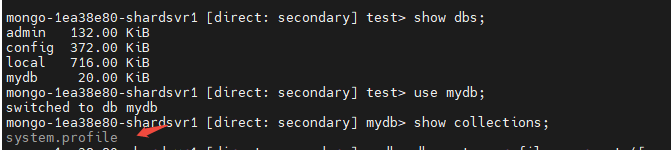
system.profile 集合(数据库内)
- 重要:
system.profile是每个数据库独立的集合 - 不是全局共享,而是在各自数据库中创建
- 只有开启了 Profiling 的数据库才会有此集合
- 默认大小:1MB(capped collection)
- 循环覆盖,自动清理旧数据
// 示例:不同数据库有各自的 system.profile use mydb; db.setProfilingLevel(1); // mydb 库会创建 system.profile db.system.profile.find(); // 查看 mydb 库的慢查询 use testdb; db.setProfilingLevel(1); // testdb 库会创建自己的 system.profile db.system.profile.find(); // 查看 testdb 库的慢查询 - 重要:
-
日志文件(文件系统)
- 输出到 MongoDB 日志
- K8s 环境通过 kubectl logs 查看
三、慢日志配置操作
3.1 查看当前配置
# 查看 Profiling 状态
kubectl exec mongo-1ea38e80-shardsvr1-2-0 -n qfusion-hxl -c mongod -- \
  mongosh -u root -p '4r_O6bGgstboins_' --authenticationDatabase admin \
  --eval "db.getProfilingStatus()"

# 查看服务器配置
kubectl exec mongo-1ea38e80-shardsvr1-2-0 -n qfusion-hxl -c mongod -- \
  mongosh -u root -p '4r_O6bGgstboins_' --authenticationDatabase admin \
  --eval "db.serverCmdLineOpts()"
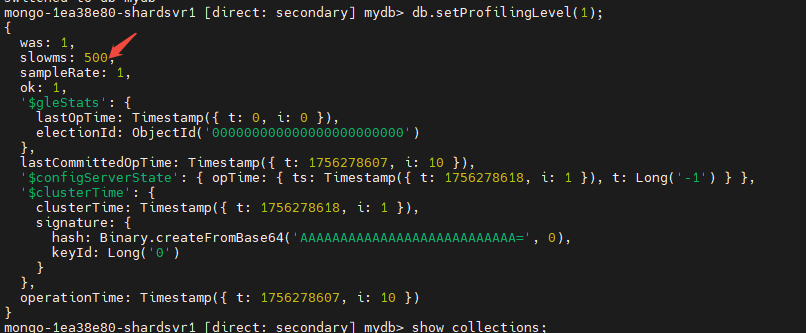
当前配置结果:
{
  was: 1,                    // Profiling级别:1(记录慢操作)
  slowms: 500,              // 慢查询阈值:500毫秒
  sampleRate: 1,            // 采样率:100%
  operationProfiling: {
    mode: 'slowOp',         // 模式:慢操作
    slowOpThresholdMs: 500  // 阈值:500ms
  }
}
3.2 修改慢日志配置
设置 Profiling 级别和阈值
# 关闭 Profiling
kubectl exec mongo-1ea38e80-shardsvr1-2-0 -n qfusion-hxl -c mongod -- \
  mongosh -u root -p '4r_O6bGgstboins_' --authenticationDatabase admin \
  --eval "db.setProfilingLevel(0)"

# 开启慢查询记录(阈值100ms)
kubectl exec mongo-1ea38e80-shardsvr1-2-0 -n qfusion-hxl -c mongod -- \
  mongosh -u root -p '4r_O6bGgstboins_' --authenticationDatabase admin \
  --eval "db.setProfilingLevel(1, { slowms: 100 })"

# 记录所有操作(谨慎使用)
kubectl exec mongo-1ea38e80-shardsvr1-2-0 -n qfusion-hxl -c mongod -- \
  mongosh -u root -p '4r_O6bGgstboins_' --authenticationDatabase admin \
  --eval "db.setProfilingLevel(2)"

# 设置采样率(50%采样)
kubectl exec mongo-1ea38e80-shardsvr1-2-0 -n qfusion-hxl -c mongod -- \
  mongosh -u root -p '4r_O6bGgstboins_' --authenticationDatabase admin \
  --eval "db.setProfilingLevel(1, { slowms: 100, sampleRate: 0.5 })"
为特定数据库设置
# 切换到目标数据库并设置
kubectl exec mongo-1ea38e80-shardsvr1-2-0 -n qfusion-hxl -c mongod -- \
  mongosh -u root -p '4r_O6bGgstboins_' --authenticationDatabase admin \
  --eval "use mydb; db.setProfilingLevel(1, { slowms: 200 })"
3.3 调整 system.profile 集合大小
# 查看当前大小
kubectl exec mongo-1ea38e80-shardsvr1-2-0 -n qfusion-hxl -c mongod -- \
  mongosh -u root -p '4r_O6bGgstboins_' --authenticationDatabase admin \
  --eval "db.system.profile.stats()"

# 重建 profile 集合(需要先关闭 profiling)
kubectl exec -it mongo-1ea38e80-shardsvr1-2-0 -n qfusion-hxl -c mongod -- \
  mongosh -u root -p '4r_O6bGgstboins_' --authenticationDatabase admin

# 在 mongosh 中执行
db.setProfilingLevel(0)
db.system.profile.drop()
db.createCollection("system.profile", { capped: true, size: 10485760 })  // 10MB
db.setProfilingLevel(1, { slowms: 100 })
四、查看慢查询记录
4.1 从 system.profile 集合查询
注意:查询前需要先切换到对应的数据库,因为每个数据库有自己的 system.profile 集合。
# 查看 admin 库的慢查询
kubectl exec mongo-1ea38e80-shardsvr1-1-0 -n qfusion-hxl -c mongod -- \
  mongosh -u root -p '4r_O6bGgstboins_' --authenticationDatabase admin \
  --eval "use admin; db.system.profile.find().limit(10).sort({ ts: -1 }).pretty()"

# 查看特定数据库(如 mydb)的慢查询
kubectl exec mongo-1ea38e80-shardsvr1-1-0 -n qfusion-hxl -c mongod -- \
  mongosh -u root -p '4r_O6bGgstboins_' --authenticationDatabase admin \
  --eval "use mydb; db.system.profile.find().limit(10).sort({ ts: -1 }).pretty()"

# 或者使用 getSiblingDB 方法
kubectl exec mongo-1ea38e80-shardsvr1-1-0 -n qfusion-hxl -c mongod -- \
  mongosh -u root -p '4r_O6bGgstboins_' --authenticationDatabase admin \
  --eval "db.getSiblingDB('mydb').system.profile.find().limit(10).sort({ ts: -1 }).pretty()"

# 查看执行时间超过1秒的查询
kubectl exec mongo-1ea38e80-shardsvr1-2-0 -n qfusion-hxl -c mongod -- \
  mongosh -u root -p '4r_O6bGgstboins_' --authenticationDatabase admin \
  --eval "db.system.profile.find({ millis: { \$gt: 1000 } }).pretty()"

# 查看特定集合的慢查询
kubectl exec mongo-1ea38e80-shardsvr1-2-0 -n qfusion-hxl -c mongod -- \
  mongosh -u root -p '4r_O6bGgstboins_' --authenticationDatabase admin \
  --eval "db.system.profile.find({ ns: 'mydb.mycollection' }).pretty()"

# 统计慢查询类型
kubectl exec mongo-1ea38e80-shardsvr1-2-0 -n qfusion-hxl -c mongod -- \
  mongosh -u root -p '4r_O6bGgstboins_' --authenticationDatabase admin \
  --eval "db.system.profile.aggregate([
    { \$group: { _id: '\$op', count: { \$sum: 1 }, avgMillis: { \$avg: '\$millis' } } },
    { \$sort: { count: -1 } }
  ])"
4.2 从容器日志查看
# 查看最近100条日志中的慢查询
kubectl logs mongo-1ea38e80-shardsvr1-2-0 -n qfusion-hxl -c mongod --tail=100 | grep -i slow

# 实时监控慢查询日志
kubectl logs -f mongo-1ea38e80-shardsvr1-2-0 -n qfusion-hxl -c mongod | grep -i slow

# 查看特定时间段的日志
kubectl logs mongo-1ea38e80-shardsvr1-2-0 -n qfusion-hxl -c mongod --since=1h | grep -i slow
4.3 慢查询记录字段说明
{
  "op": "query",              // 操作类型:query, insert, update, remove, command
  "ns": "mydb.mycollection",  // 命名空间:数据库.集合
  "command": {...},            // 执行的命令详情
  "millis": 1234,             // 执行时间(毫秒)
  "ts": ISODate(),            // 时间戳
  "client": "10.0.0.1",       // 客户端IP
  "user": "appuser",          // 执行用户
  "nreturned": 100,           // 返回文档数
  "responseLength": 2048,      // 响应大小(字节)
  "planSummary": "IXSCAN",    // 执行计划摘要
  "execStats": {...},          // 执行统计
  "locks": {...},              // 锁信息
  "storage": {...}             // 存储引擎信息
}
五、慢查询分析与优化
5.1 常见慢查询原因
| 原因 | 特征 | 解决方案 |
|---|---|---|
| 缺少索引 | planSummary: COLLSCAN | 创建合适的索引 |
| 索引选择错误 | 使用了低效索引 | 优化索引或使用 hint |
| 返回数据量大 | nreturned 很大 | 添加分页或投影 |
| 锁竞争 | locks.timeAcquiringMicros 高 | 优化并发访问 |
| 内存不足 | 频繁的磁盘IO | 增加内存或优化查询 |
5.2 分析慢查询示例
# 找出最慢的查询操作
kubectl exec mongo-1ea38e80-shardsvr1-2-0 -n qfusion-hxl -c mongod -- \
  mongosh -u root -p '4r_O6bGgstboins_' --authenticationDatabase admin \
  --eval "db.system.profile.find({}, {
    op: 1,
    ns: 1,
    millis: 1,
    ts: 1,
    planSummary: 1
  }).sort({ millis: -1 }).limit(10)"

# 分析特定集合的索引使用情况
kubectl exec mongo-1ea38e80-shardsvr1-2-0 -n qfusion-hxl -c mongod -- \
  mongosh -u root -p '4r_O6bGgstboins_' --authenticationDatabase admin \
  --eval "db.system.profile.aggregate([
    { \$match: { ns: 'mydb.mycollection' } },
    { \$group: {
      _id: '\$planSummary',
      count: { \$sum: 1 },
      avgMillis: { \$avg: '\$millis' }
    }},
    { \$sort: { avgMillis: -1 } }
  ])"

# 查看全表扫描的查询
kubectl exec mongo-1ea38e80-shardsvr1-2-0 -n qfusion-hxl -c mongod -- \
  mongosh -u root -p '4r_O6bGgstboins_' --authenticationDatabase admin \
  --eval "db.system.profile.find({
    planSummary: 'COLLSCAN'
  }, {
    ns: 1,
    millis: 1,
    command: 1
  }).sort({ millis: -1 })"
六、监控脚本示例
6.1 实时慢查询监控脚本
#!/bin/bash
# 文件:monitor_slow_queries.sh

NAMESPACE="qfusion-hxl"
POD="mongo-1ea38e80-shardsvr1-2-0"
THRESHOLD=100  # 毫秒

echo "监控慢查询(阈值: ${THRESHOLD}ms)..."

while true; do
  kubectl exec $POD -n $NAMESPACE -c mongod -- \
    mongosh -u root -p '4r_O6bGgstboins_' --authenticationDatabase admin \
    --quiet --eval "
      var slowQueries = db.system.profile.find({
        millis: { \$gt: $THRESHOLD },
        ts: { \$gt: new Date(Date.now() - 60000) }  // 最近1分钟
      }).toArray();

      if (slowQueries.length > 0) {
        print('=== 发现 ' + slowQueries.length + ' 条慢查询 ===');
        slowQueries.forEach(function(q) {
          print('时间: ' + q.ts);
          print('耗时: ' + q.millis + 'ms');
          print('操作: ' + q.op);
          print('命名空间: ' + q.ns);
          print('执行计划: ' + q.planSummary);
          print('---');
        });
      }
    "
  sleep 30
done
6.2 慢查询日报生成脚本
#!/bin/bash
# 文件:slow_query_report.sh

NAMESPACE="qfusion-hxl"
POD="mongo-1ea38e80-shardsvr1-2-0"
REPORT_FILE="slow_query_report_$(date +%Y%m%d).txt"

echo "生成慢查询报告..."

kubectl exec $POD -n $NAMESPACE -c mongod -- \
  mongosh -u root -p '4r_O6bGgstboins_' --authenticationDatabase admin \
  --quiet --eval "
    print('MongoDB 慢查询日报 - ' + new Date().toLocaleDateString());
    print('=====================================');

    // 统计信息
    var stats = db.system.profile.aggregate([
      { \$match: {
        ts: { \$gte: new Date(Date.now() - 86400000) }  // 最近24小时
      }},
      { \$group: {
        _id: null,
        total: { \$sum: 1 },
        avgMillis: { \$avg: '\$millis' },
        maxMillis: { \$max: '\$millis' }
      }}
    ]).toArray()[0];

    if (stats) {
      print('总慢查询数: ' + stats.total);
      print('平均耗时: ' + Math.round(stats.avgMillis) + 'ms');
      print('最大耗时: ' + stats.maxMillis + 'ms');
    }

    print('\\n按操作类型统计:');
    db.system.profile.aggregate([
      { \$match: {
        ts: { \$gte: new Date(Date.now() - 86400000) }
      }},
      { \$group: {
        _id: '\$op',
        count: { \$sum: 1 },
        avgMillis: { \$avg: '\$millis' }
      }},
      { \$sort: { count: -1 } }
    ]).forEach(function(item) {
      print('  ' + item._id + ': ' + item.count + '次, 平均' +
            Math.round(item.avgMillis) + 'ms');
    });

    print('\\nTOP 10 最慢查询:');
    db.system.profile.find({
      ts: { \$gte: new Date(Date.now() - 86400000) }
    }).sort({ millis: -1 }).limit(10).forEach(function(q, i) {
      print((i+1) + '. ' + q.millis + 'ms - ' + q.op + ' - ' + q.ns);
    });
  " > $REPORT_FILE

echo "报告已生成: $REPORT_FILE"
七、最佳实践建议
7.1 生产环境配置建议
| 环境 | Profiling级别 | 阈值建议 | 采样率 | 说明 |
|---|---|---|---|---|
| 开发 | 1 | 100ms | 1.0 | 全量采集,便于优化 |
| 测试 | 1 | 200ms | 1.0 | 发现性能问题 |
| 预生产 | 1 | 500ms | 0.5 | 模拟生产环境 |
| 生产 | 1 | 1000ms | 0.1 | 最小性能影响 |
7.2 慢查询优化流程
7.3 注意事项
-
性能影响
- Profiling 会带来 5-10% 的性能开销
- 生产环境建议只记录真正的慢查询(>1秒)
- 使用采样率降低开销
-
存储管理
- system.profile 是 capped collection,会自动覆盖
- 重要的慢查询信息需要定期导出保存
- 考虑使用外部监控工具长期保存
-
安全考虑
- 慢日志可能包含敏感数据
- 限制 system.profile 的访问权限
- 定期清理或脱敏导出的日志
-
监控告警
- 设置慢查询数量告警
- 监控平均响应时间趋势
- 关注特定关键业务的查询性能
八、故障排查快速指南
8.1 快速检查命令
# 1. 检查当前配置
kubectl exec mongo-1ea38e80-shardsvr1-2-0 -n qfusion-hxl -c mongod -- \
  mongosh -u root -p '4r_O6bGgstboins_' --authenticationDatabase admin \
  --eval "db.getProfilingStatus()"

# 2. 查看最近的慢查询
kubectl exec mongo-1ea38e80-shardsvr1-2-0 -n qfusion-hxl -c mongod -- \
  mongosh -u root -p '4r_O6bGgstboins_' --authenticationDatabase admin \
  --eval "db.system.profile.find().sort({ts:-1}).limit(5)"

# 3. 查看当前正在执行的慢操作
kubectl exec mongo-1ea38e80-shardsvr1-2-0 -n qfusion-hxl -c mongod -- \
  mongosh -u root -p '4r_O6bGgstboins_' --authenticationDatabase admin \
  --eval "db.currentOp({'secs_running': {\$gte: 1}})"

# 4. 终止慢查询
kubectl exec mongo-1ea38e80-shardsvr1-2-0 -n qfusion-hxl -c mongod -- \
  mongosh -u root -p '4r_O6bGgstboins_' --authenticationDatabase admin \
  --eval "db.killOp(<opid>)"
8.2 常见问题处理
| 问题 | 原因 | 解决方法 |
|---|---|---|
| system.profile 为空 | Profiling 未开启 | 执行 db.setProfilingLevel(1) |
| 日志没有慢查询记录 | 阈值设置过高 | 降低 slowms 值 |
| 性能影响明显 | 采样率过高 | 降低 sampleRate |
| 存储空间不足 | profile 集合太小 | 重建更大的 profile 集合 |
九、总结
关键配置信息
- 当前慢查询阈值: 500ms
- Profiling 级别: 1(只记录慢操作)
- 存储位置: system.profile 集合(每个数据库独立)
- 日志查看: kubectl logs 或 system.profile 集合
核心命令速查
# 查看配置
db.getProfilingStatus()

# 设置阈值
db.setProfilingLevel(1, { slowms: 100 })

# 查看慢查询
db.system.profile.find().limit(10)

# 查看容器日志
kubectl logs <pod> -n <namespace> -c mongod | grep -i slow
优化建议
- 根据业务特点调整慢查询阈值
- 定期分析慢查询日志,主动优化
- 建立慢查询监控告警机制
- 保持索引策略与查询模式同步
文档版本: v1.0
更新日期: 2025-08-27
适用版本: MongoDB 5.0.26
维护团队: MongoDB 运维团队

惟楚有才,于斯为盛。欢迎来到长沙!!! 茶颜悦色、臭豆腐、CSDN和你一个都不能少~
更多推荐

 8
8 0
0- 0


 已为社区贡献7条内容

所有评论(0)