Streamlit 组件 - 使用 Plotly.js 进行选择的散点图
Streamlit 组件出炉!这开启了许多新的可能性,因为它可以轻松地将任何交互式 Javascript 库集成到 Streamlit 中,并在 Python 脚本和 React 组件之间来回发送数据。
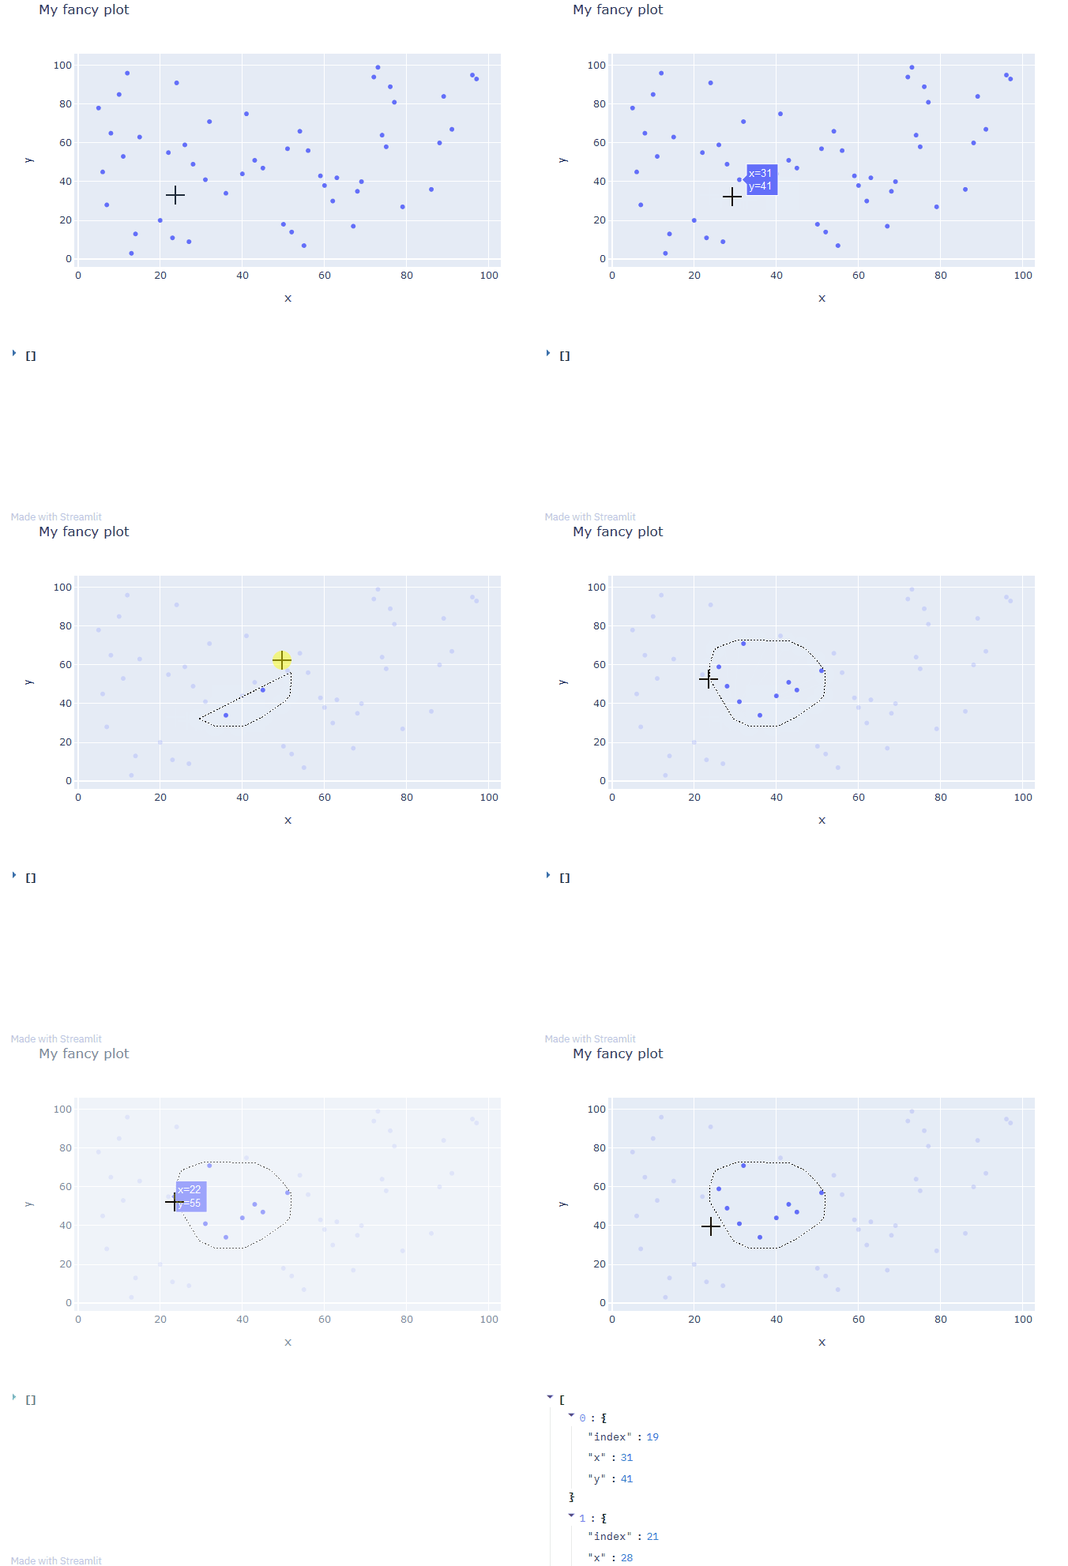
让我们围绕它构建一个快速示例,以帮助快速启动关于 Plotly 交叉交互过滤](https://discuss.streamlit.io/t/could-we-have-plotly-figurewidget-support/4271)的论坛问题的答案[:我们可以构建一个散点图,将选定的点发送回 Python 吗?我们将通过创建一个带有套索选择的 Plotly.js 组件来解决这个问题,并将选择的点传达给 Python。
[ ](https://res.cloudinary.com/practicaldev/image/fetch/s--sH4ocpEO--/c_limit%2Cf_auto%2Cfl_progressive%2Cq_66%2Cw_880/https://dev- to-uploads.s3.amazonaws.com/i/tucjnm38metahzgxemhe.gif)
虽然没有 JS/React 经验的任何人都可以访问本教程,但我确实跳过了一些重要的前端/React 概念。我有一个更长的教程here解决了这些问题,但如果你想更深入,请不要犹豫查看 React 网站。
先决条件:情节如何运作?
许多数据科学家使用plotly.py来构建交互式图表。 plotly.py 实际上是plotly.js的 Python 包装器。 Plotly 图形由 Python 客户端为您生成的 JSON 规范表示,plotly.js 可以使用它来呈现图形。
如果您从 Vega 生态系统中了解 Altair,那么 Altair 作为 Vega-lite 的 Python 包装器,其工作方式与 plotly.py 是 plotly.js 的 Python 包装器完全相同。
您可以从 Python 中的图形中检索 JSON 规范:
import plotly.express as px
fig = px.line(x=["a","b","c"], y=[1,3,2], title="sample figure")
fig.to_json()

# renders a somewhat big JSON spec
# {"data":[{"hovertemplate":"x=%{x}<br>y=%{y}<extra></extra>","legendgroup":"","line":{"color":"#636efa","dash":"solid"},"mode":"lines","name":"", ...
进入全屏模式 退出全屏模式
并将此 JSON 规范复制到 Plotly.js 元素中以查看渲染结果。这是用于演示的 Codepen。
请务必注意,许多 JS 图表库通过将 JSON 规范传递给它们来工作。查看 echarts、Chart.js、Vega-lite、Victory 的文档...
这里的要点是可以复制此过程以集成其他图表库!
我们的第一个任务是通过将 plotly Figure 的 JSON 表示传递给 Javascript 库进行渲染来复制streamlit.plotly_charts。
设置
在学习本教程之前,您需要在系统上安装 Python/Node.js。
首先克隆streamlit component-template,然后将模板文件夹移动到您常用的工作区。
git clone https://github.com/streamlit/component-template
cp -r component-template/template ~/streamlit-custom-plotly
进入全屏模式 退出全屏模式
从现在开始,我们假设后面的每个 shell 命令都是从streamlit-custom-plotly文件夹中完成的。
为此,我们需要 2 个终端:一个将运行 Streamlit 服务器,另一个是包含 Javascript 组件的开发服务器。
- 在终端中,安装前端依赖,然后运行组件服务器。
cd my_component/frontend
npm install    # Initialize the project and install npm dependencies
npm run start  # Start the Webpack dev server
进入全屏模式 退出全屏模式
- 在另一个终端,创建Streamlit≥0.63的Python环境,然后运行
__init__.py脚本
conda create -n streamlit-custom python=3 streamlit  # Create Conda env (or other Python environment manager)
conda activate streamlit-custom  # Activate environment
streamlit run my_component/__init__.py  # Run Streamlit app
进入全屏模式 退出全屏模式
您应该会在新浏览器中看到自定义组件的 Streamlit Hello 世界:
[ ](https://res.cloudinary.com/practicaldev/image/fetch/s--SIEiOKoU--/c_limit%2Cf_auto%2Cfl_progressive%2Cq_auto%2Cw_880/https://dev- to-uploads.s3.amazonaws.com/i/pgnd4qsxdw7ke889uo8o.png)
第 1 步 - “Hello world”
前往你最喜欢的代码编辑器编辑前端代码,只渲染“Hello world”。删除my_component/frontend/src/MyComponent.tsx中的所有内容并粘贴以下代码以呈现单个 Hello world 块:
import React, { useEffect } from "react"
import { withStreamlitConnection, Streamlit } from "./streamlit"

function MyComponent() {
  useEffect(() => Streamlit.setFrameHeight())

  return <p>Hello world</p>
}

export default withStreamlitConnection(MyComponent)
进入全屏模式 退出全屏模式
我们还应该清理my_component/__init__.py中正在运行的 Streamlit:
import streamlit as st
import streamlit.components.v1 as components

_component_func = components.declare_component(
    "my_component",
    url="http://localhost:3001",
)

def my_component():
    return _component_func()

st.subheader("My Component")
my_component()
进入全屏模式 退出全屏模式
我们在 Streamlit 世界中,所以 livereload 随处启用,并且您的浏览器中的更新应该是即时的。
[ ](https://res.cloudinary.com/practicaldev/image/fetch/s--qI4VZWmc--/c_limit%2Cf_auto%2Cfl_progressive%2Cq_auto%2Cw_880/https://dev- to-uploads.s3.amazonaws.com/i/4qkzqbtwlb1m9vsv6icx.png)
如果我们想稍微了解一下,在 Python 端,我们有一个包装器my_component()函数,它调用一个私有_component_func()。这个由components.declare_component返回的私有函数从 urlhttp://localhost:3001访问前端资源,另一个正在运行的开发服务器提供前端组件!
在 Javascript 方面,我们定义了一个功能组件MyComponent,它返回一个内部带有“Hello world”的块。这是由 Streamlit 检索并在浏览器中呈现的开发服务器提供的输出。
我们还使用了一个 React 钩子useEffect,它在组件渲染后运行匿名回调函数来计算渲染的高度,然后更新包含该组件的 iframe 的高度。如果您省略该功能,您的组件的高度将为 0 并且肉眼不可见,但如果您使用浏览器的开发工具检查页面源代码,它实际上会存在。
第 2 步 - Python 和 React 之间的双向通信
my_component/__init__.py中的_component_func管理对前端 Web 服务器的调用以获取组件。通过这个函数传递的任何参数都被 JSON 序列化到 React 组件。例如,Python 字典作为 JSON 对象传递给开发 Web 服务器,并在我们的前端对应项中可用。
是时候为调用添加一些参数了:
import streamlit as st
import streamlit.components.v1 as components

_component_func = components.declare_component(
    "my_component",
    url="http://localhost:3001",
)

def my_component():
    return _component_func(test="world") # <-- add some parameters in the call

st.subheader("My Component")
my_component()
进入全屏模式 退出全屏模式
并在my_component/frontend/src/MyComponent.tsx的 React 端检索它们
import React, { useEffect } from "react"
import { withStreamlitConnection, Streamlit, ComponentProps } from "./streamlit"

// Your function has arguments now !
function MyComponent(props: ComponentProps) {
  useEffect(() => Streamlit.setFrameHeight())

  // Paramters from _component_func are stored in props.args
  return <p>Hello {props.args.test}</p>
}

export default withStreamlitConnection(MyComponent)
进入全屏模式 退出全屏模式
浏览器中的 Livereload 应该使更新可见!
[ ](https://res.cloudinary.com/practicaldev/image/fetch/s--lgV7qH84--/c_limit%2Cf_auto%2Cfl_progressive%2Cq_auto%2Cw_880/https://dev- to-uploads.s3.amazonaws.com/i/r5nizkxop02rsg0jmu6n.png)
在这里,我们设置了从 Python 到 Javascript 的数据通信。要将数据从 Javascript 发送到 Python,我们使用Streamlit.setComponentValue()方法,然后将该值存储为_component_func的返回值:
import React, { useEffect } from "react"
import { withStreamlitConnection, Streamlit, ComponentProps } from "./streamlit"

function MyComponent(props: ComponentProps) {
  useEffect(() => Streamlit.setFrameHeight())
  useEffect(() => Streamlit.setComponentValue(42)) // return value to Python after the component has rendered

  return <p>Hello {props.args.test}</p>
}

export default withStreamlitConnection(MyComponent)
进入全屏模式 退出全屏模式
然后在 Python 方面:
import streamlit as st
import streamlit.components.v1 as components

_component_func = components.declare_component(
    "my_component",
    url="http://localhost:3001",
)

def my_component():
    return _component_func(test="test") # value from Streamlit.setComponentValue is now returned !

st.subheader("My Component")
v = my_component()
st.write(v)
进入全屏模式 退出全屏模式
[ ](https://res.cloudinary.com/practicaldev/image/fetch/s--IXuDo-nR--/c_limit%2Cf_auto%2Cfl_progressive%2Cq_auto%2Cw_880/https:// dev-to-uploads.s3.amazonaws.com/i/nz3sz179sgcx80y4qxp4.png)
PS:在渲染组件时,您可能会短暂看到v = None。您可以使用default参数更改_component_func返回的默认值:return _component_func(test="test", default=42)
第 3 步 - 静态 Plotly.js 绘图
是时候让事情变得更有趣了,让我们传递 Plotly 图的 JSON 表示并用[react-plotly](%5Bhttps://plotly.com/javascript/react/%5D(https://plotly.com/javascript/react/)渲染它。
首先安装前端依赖项:
cd my_component/frontend  # make sure you are running this from the frontend folder !
npm install react-plotly.js plotly.js @types/react-plotly.js
进入全屏模式 退出全屏模式
使用react-plotly 快速入门代码inmy_component/frontend/src/MyComponent.tsx测试安装:
import React, { useEffect } from "react"
import { withStreamlitConnection, Streamlit, ComponentProps } from "./streamlit"
import Plot from "react-plotly.js"  // new dependency

function MyComponent(props: ComponentProps) {
  useEffect(() => Streamlit.setFrameHeight())

  // we just changed the return value of the functional component to the one from https://plotly.com/javascript/react/#quick-start
  return (
    <Plot
      data={[
        {
          x: [1, 2, 3],
          y: [2, 6, 3],
          type: "scatter",
          mode: "lines+markers",
          marker: { color: "red" },
        },
        { type: "bar", x: [1, 2, 3], y: [2, 5, 3] },
      ]}
      layout={{ width: 400, height: 400, title: "A Fancy Plot" }}
    />
  )
}

export default withStreamlitConnection(MyComponent)
进入全屏模式 退出全屏模式
受到您的 plotly.js 情节的欢迎!
[ ](https://res.cloudinary.com/practicaldev/image/fetch/s---nEpBfyQ--/c_limit%2Cf_auto%2Cfl_progressive%2Cq_auto%2Cw_880/https://dev -to -uploads.s3.amazonaws.com/i/cku1yr3rr38hprzq3k6h.png)
NB:我在那里得到了FATAL ERROR: Ineffective mark-compacts near heap limit Allocation failed - JavaScript heap out of memory,我用NODE_OPTIONS变量[https://stackoverflow.com/questions/53230823/fatal-error-ineffective-mark-compacts-near-heap-limit-allocation-failed-javas]解决了这个问题(https://stackoverflow.com/questions/53230823/fatal-error-ineffective-mark-compacts-near-heap-limit-allocation-failed-javas).
现在让我们传递 Python 图,并在包装器中提取 JSON 规范以推送到 JS 端。在my_component/__init__.py中:
import random
import plotly.express as px
import streamlit as st
import streamlit.components.v1 as components

_component_func = components.declare_component(
    "my_component",
    url="http://localhost:3001",
)

def my_component(fig):
    return _component_func(spec=fig.to_json(), default=42)

st.subheader("My Component")
fig = px.scatter(x=random.sample(range(100), 50), y=random.sample(range(100), 50), title="My fancy plot")
v = my_component(fig)
st.write(v)
进入全屏模式 退出全屏模式
然后在 Javascript 端取回my_component/frontend/src/MyComponent.tsx
import React, { useEffect } from "react"
import { withStreamlitConnection, Streamlit, ComponentProps } from "./streamlit"
import Plot from "react-plotly.js"

function MyComponent(props: ComponentProps) {
  useEffect(() => Streamlit.setFrameHeight())
  useEffect(() => Streamlit.setComponentValue(42))

  const { data, layout, frames, config } = JSON.parse(props.args.spec)

  return (
    <Plot
      data={data}
      layout={layout}
      frames={frames}
      config={config}
    />
  )
}

export default withStreamlitConnection(MyComponent)
进入全屏模式 退出全屏模式
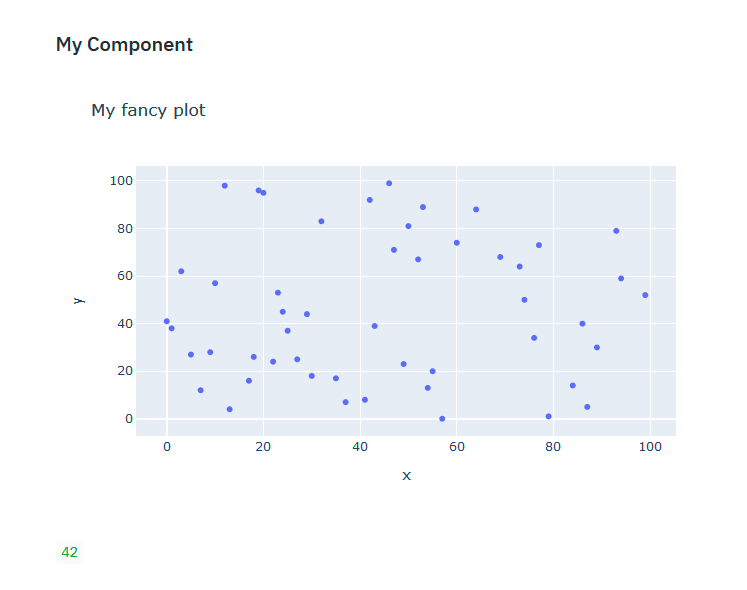
您的 plotly express 情节现在应该出现:
[ ](https://res.cloudinary.com/practicaldev/image/fetch/s--9Bxwas2G--/c_limit%2Cf_auto%2Cfl_progressive%2Cq_auto%2Cw_880/https://dev- to-uploads.s3.amazonaws.com/i/w36xxh0gjqlycnllrk5q.png)
为什么我们将 JSON 作为字符串传递给 JS 端重新解析它?实际上,我最初使用
fig.to_dict在_component_func中传递一个 Dict。然后它应该直接作为 Javascript 对象序列化,但它实际上导致了Error serializing numpy.ndarray,需要将 numpy 数组转换为 Python 列表,因此它们可以被认为是 JSON 可序列化的。我认为有一个plotly.utils.PlotlyJSONEncoder可以为您完成但尚未测试...
如果您重新渲染应用程序,Streamlit 将使用新数据点从头开始重新创建绘图。对于我们的示例,我们可以将数据放入缓存中。_component_func还有一个key参数,它可以防止组件在 Streamlit 应用程序重新呈现时从头开始重新安装:
import random
import plotly.express as px
import streamlit as st
import streamlit.components.v1 as components

_component_func = components.declare_component(
    "my_component",
    url="http://localhost:3001",
)

def my_component(fig):
    # add key to _component_func so component is not destroyed/rebuilt on rerender
    return _component_func(spec=fig.to_json(), default=42, key="key")

# data in cache
@st.cache
def random_data():
    return random.sample(range(100), 50), random.sample(range(100), 50)

st.subheader("My Component")
x, y = random_data()
fig = px.scatter(x=x, y=y, title="My fancy plot")
v = my_component(fig)
st.write(v)
进入全屏模式 退出全屏模式
第 4 步 - Plotly.js 中的选择
我们如何将回调函数绑定到 plotly.js 中的套索选择?我们的兴趣是在此回调中使用Streamlit.setComponentValue()将选定的数据点返回给 Streamlit。
该页面显示应在plotly_selected上侦听回调事件,该事件在react-plotly。定义一个处理程序以获取有关选定点的信息:
import React, { useEffect } from "react"
import { withStreamlitConnection, Streamlit, ComponentProps } from "./streamlit"
import Plot from "react-plotly.js"

function MyComponent(props: ComponentProps) {
  useEffect(() => Streamlit.setFrameHeight())

  const handleSelected = function (eventData: any) {
    Streamlit.setComponentValue(
      eventData.points.map((p: any) => {
        return { index: p.pointIndex, x: p.x, y: p.y }
      })
    )
  }

  const { data, layout, frames, config } = JSON.parse(props.args.spec)

  return (
    <Plot
      data={data}
      layout={layout}
      frames={frames}
      config={config}
      onSelected={handleSelected}
    />
  )
}

export default withStreamlitConnection(MyComponent)
进入全屏模式 退出全屏模式
您可以在 Python 包装器中处理返回的点以仅返回索引或坐标,具体取决于您的用例:
import random
import plotly.express as px
import streamlit as st
import streamlit.components.v1 as components

_component_func = components.declare_component(
    "my_component",
    url="http://localhost:3001",
)

def my_component(fig):
    points = _component_func(spec=fig.to_json(), default=[], key="key")
    return points

@st.cache
def random_data():
    return random.sample(range(100), 50), random.sample(range(100), 50)

st.subheader("My Component")
x, y = random_data()
fig = px.scatter(x=x, y=y, title="My fancy plot")
v = my_component(fig)
st.write(v)
进入全屏模式 退出全屏模式
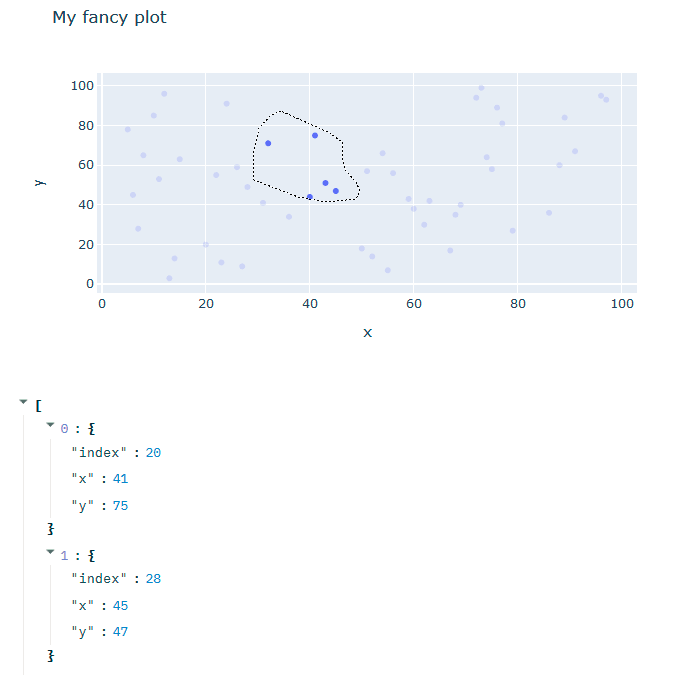
您现在可以使用您的情节图并在 Python 中取回选定的数据:
[ ](https://res.cloudinary.com/practicaldev/image/fetch/s--u_JwVAM2--/c_limit%2Cf_auto%2Cfl_progressive%2Cq_auto%2Cw_880/https://dev- to-uploads.s3.amazonaws.com/i/0qkwy4tmu2gismuo5tvu.png)
这里仍然存在一些问题,例如使用onDeselect道具取消选择点时没有回调,我将把它作为练习:)。
结论
希望这个小教程能帮助您在 Streamlit 中启动新的交互式图表库。如果您不想使用通用包装器实现,您可以快速创建非常具体的自定义图表,不要犹豫,玩这个! plotly.js 页面甚至在同一组件的多个图中显示了交叉过滤器,因此您可以在 Python 中进行数据操作并在 Plotly.js 中进行额外的可视化。
资源
- 配套代码
更多推荐
 已为社区贡献20427条内容


所有评论(0)