
Clickhouse+UXGIS气象格点数据管理方案
作者:Steven.T
一、数据介绍
气象格点数据是一种典型的大数据,每天产生的数据量庞大,气象格点数据特点:时序性、数据量庞大、具备空间信息、格式种类多,其应用场景:气象分析预测和制图可视化。传统的管理方式是文件系统+关系型数据库,目前,已难以应对庞大的存储和提供高效的查询。本文介绍Clickhouse+UXDB UXGIS气象格点数据管理方案。
二、架构介绍
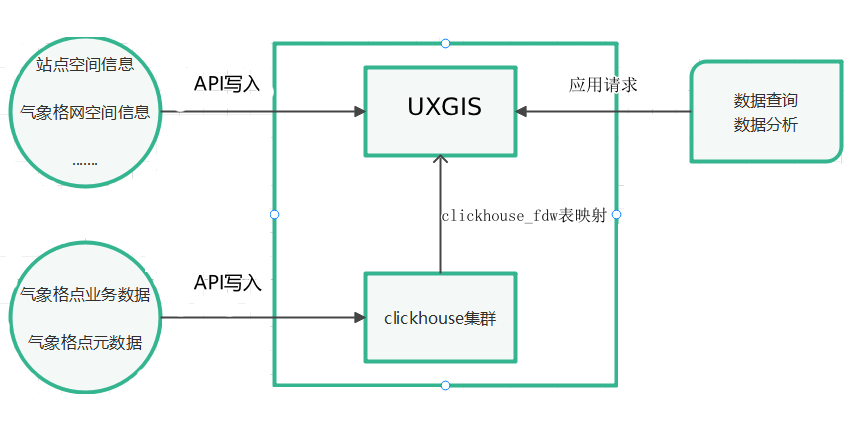
Clickhouse是一款开源的列式数据库引擎,天生具备高效的检索和分析特性。在方案中作为气象格点数据的存储引擎。
UXGIS是UXDB数据库的空间扩展,使得UXDB具备空间分析能力,且在功能强大,在方案中作为空间分析引擎。
通过clickhouse_fdw外部包装器将clickhouse中的业务数据表映射到UXGIS中,用户只需访问UXGIS就可以完成对数据的查询、分析。

三、存储设计
气象格点数据是一种多维数据集,其包含自述性的元数据、单个或多个业务数据。因此我们设计2张表来存储格点数据,一是元数据表,将属性名与属性值作为字段,存储多行记录,二是业务数据表,其包含单个或多个业务数据,每个业务数据作为一列存储,其次还需要保留其时间维度,空间经纬度信息。
格点元数据:
create table m_world_fy3e (
     attribute   String,
     val         String
     ) engine = MergeTree() order by attribute;
alter table m_world_fy3e comment column  attribute '属性' ;
alter table m_world_fy3e comment column  val '值' ;
格点业务数据:
create table b_world_fy3e_d (datatime            String,
                             grid_lat            Float32,
                             grid_lon            Float32,
                             model_dir           UInt16,
                             model_speed         UInt16,
                             wind_dir_selected   UInt16,
                             wind_speed_selected UInt16,
                             lat_union_lon       String) engine = MergeTree()
                             PARTITION BY datatime order by subString(datatime,1,7);
alter table m_world_fy3e comment column  datatime '日期' ;
alter table m_world_fy3e comment column  grid_lat '纬度' ;
alter table m_world_fy3e comment column  grid_lon '经度' ;
alter table m_world_fy3e comment column  model_dir '业务1' ;
alter table m_world_fy3e comment column  model_speed '业务2' ;
alter table m_world_fy3e comment column  wind_dir_selected '业务3' ;
alter table m_world_fy3e comment column  wind_speed_selected '业务4' ;
alter table m_world_fy3e comment column  lat_union_lon '纬度拼接经度' ;
alter table b_world_fy3e_d add index idx_lat_lon(lat_union_lon) TYPE minmax GRANULARITY 3;
四、实施步骤
4.1 数据准备
气象格点数据是一种周期规律生产的时序数据,经典业务场景涵盖时间点查询、一定时间周期的查询、统计分析,为此我们需要准备相关测试数据。
| 数据名称 | 存储引擎 | 描述 | 表名 |
|---|---|---|---|
| 气象格点业务数据 | clickhouse | 周期100天,数据格式:HDF | b_world_fy3e_d |
| 随机500个点空间数据 | UXGIS | 数据存储格式:geometry(point, 4326) | gis_point |
| 空格点 | UXGIS | 数据存储格式:raster,存储与业务格点数据一致的空间格网信息 | ras_world_fy3e |
4.2 HDF格点数据解析
- python解析脚本
HDF是一种专业的气象数据格式,对其数据的操作需要借助开源的代码库GDAL,GDAL库提供了多种语言(JAVA、PYTHON等)的API,这里我们使用PYTHON来解析HDF文件,将数据导入ClickHouse,对于统一规范的HDF文件可以做到自动化解析入库,且效率高,100w行数据,从解析到入库只需20-30s.
import sys
from osgeo import gdal
import numpy as np
import psycoux2 as ux
import matplotlib as mpl
import time
import clickhouse_driver as cli

#获取数据
def getdata(inpathHDF):
    dataset = gdal.Open(inpathHDF)
    subdatasets = dataset.GetSubDatasets()
    date = dataset.GetMetadata()['Data_Creating_Date']
    metadata = dataset.GetMetadata()
    print(metadata)
    subdatasetslist = [i[0] for i in subdatasets]
    filenamelist = []
    alldatalist = []
    for file in subdatasetslist:
        subdataset = gdal.Open(file)
        filename = file.split('/')[-1]
        filenamelist.append(filename)
        subdataarray = subdataset.GetRasterBand(1).ReadAsArray()
        rows = subdataset.RasterYSize
        cols = subdataset.RasterXSize
        vallist = []
        for row in range(0,rows):
            for col in range(0,cols):
               vallist.append(subdataarray[row][col])
        alldatalist.append(vallist)
    print('已获取数据')
    dataarray = np.array(alldatalist,dtype='float32').transpose()
    filenamelist.append('datatime,lat_union_lon')
    return dataarray,filenamelist,date,metadata

#数据导入clickhouse
def inputclickhouse(cur,data,fieldlist,date,tabname):
    fieldstr = ','.join(i for i in fieldlist)
    cur.execute("select * from system.tables where database='griddb' and name='{0}'".format(tabname))
    if cur.rowcount == 0:
        print('表不存在')
        sys.exit()
    cur.execute('truncate table {0}'.format(tabname))
    print(time.time())
    #处理数据拼接上日期
    datalist = [k+[date.replace('-','')]+[(str(k[0])+str(k[1])).replace('.','')] for k in data.tolist()]
    print(time.time())
    print('datalist遍历完成')
    print(datalist[:10])
    sql = "insert into {0}  ( {1}) values".format(tabname, fieldstr)
    try:
        cur.execute(sql,datalist)
    except Exception as e:
        print(e)
        sys.exit()
    print(time.time())
    print('数据入库完成')

#元数据入库
def inputclickousemetadata(cur,inmetadata,tabname):
    cur.execute('truncate table {0}'.format(tabname))
    data = []
    keylist = [i.replace('-','_') for i in inmetadata.keys() ]
    valuelist = [j for j in inmetadata.values() ]
    data.append(keylist)
    data.append(valuelist)
    dataarray= np.array(data)
    datalist = dataarray.transpose().tolist()
    sql = "insert into {0}  values".format(tabname)
    try:
        cur.execute(sql, datalist)
    except Exception as e:
        print(e)
        sys.exit()
    print('元数据入库完成')

if __name__ == "__main__":
    conn = cli.connect(host='192.168.101.137',
                       port=9000,
                       user='default',
                       password='',
                       database='griddb')
    cur = conn.cursor()
    datas,fields,date,metedatas =  getdata('hdf.HDF')
    inputclickousemetadata(cur,metedatas,'m_world_fy3e')
    inputclickhouse(cur,datas,fields,date,'b_world_fy3e_d')
    conn.close()  3.空间统计
- 数据展示
ux-1.novalocal :) select * from b_world_fy3e_d limit 10;

SELECT *
FROM b_world_fy3e_d
LIMIT 10

Query id: 098367e4-0850-4e3b-bfdf-b1af3758b7de

┌─datatime┬grid_lat┬grid_lon┬model_dir┬model_speed┬wind_dir_selected┬wind_speed_selected┬lat_union_lon─┐
│ 20210826 │       90 │     -180 │     32767 │       32767 │             32767 │         32767 │ 9000-18000
│ 20210826 │       90 │  -179.75 │     32767 │       32767 │             32767 │         32767 │ 9000-17975
│ 20210826 │       90 │   -179.5 │     32767 │       32767 │             32767 │         32767 │ 9000-17950
│ 20210826 │       90 │  -179.25 │     32767 │       32767 │             32767 │         32767 │ 9000-179250
│ 20210826 │       90 │     -179 │     32767 │       32767 │             32767 │         32767 │ 9000-179000
│ 20210826 │       90 │  -178.75 │     32767 │       32767 │             32767 │         32767 │ 9000-178750
│ 20210826 │       90 │   -178.5 │     32767 │       32767 │             32767 │         32767 │ 9000-178500
│ 20210826 │       90 │  -178.25 │     32767 │       32767 │             32767 │         32767 │ 9000-178250
│ 20210826 │       90 │     -178 │     32767 │       32767 │             32767 │         32767 │ 9000-178000
│ 20210826 │       90 │  -177.75 │     32767 │       32767 │             32767 │         32767 │ 9000-177750     │
└──────────┴──────────┴──────────┴───────────┴─────────────┴───────────────────┴─────────────────────┴───────────────┘
注:源HDF文件3M
┌─table_name──────┬─row_num─┬─org_size──┬─compress_size─┬─compress_ratio─┐
│ b_world_fy3e_d │ 1036800 │ 33.90 MiB │ 8.66 MiB      │             26 │
│ m_world_fy3e    │      83 │ 2.70 KiB  │ 1.37 KiB      │             51 │
└─────────────────┴─────────┴───────────┴───────────────┴────────────────┘
4.3 uxdb表创建
按照架构设计,UXGIS作为空间分析引擎,将存储具备空间信息表,而业务数据将通过FDW包装外部表的形式引入ux。
- 随机500点空间数据
create table gis_point (id serial ,geom geometry(point,4326));
with tab as (
select random() as num  from generate_series(0,500))
insert into gis_point (geom)
select st_geomfromtext('point('||round(num::numeric,5)*180||' '||round(num::numeric,5)*90||')',4326) from tab
-
空格点
create table ras_world_fy3e(id serial,rast raster); insert into ras_world_fy3e(rast) values(st_addband(st_makeemptyraster(1440,720,-180,90,0.25,-0.25,0,0,4326),'8BUI'::text,255)); -
业务外部映射表
CREATE FOREIGN TABLE IF NOT EXISTS public.b_world_fy3e_d(
    datatime numeric  ,
    grid_lat numeric ,
    grid_lon numeric ,
    model_dir numeric ,
    model_speed numeric ,
    wind_dir_selected numeric ,
    wind_speed_selected numeric ,
    lat_union_lon varchar(100)
)
    SERVER clickhouse_svr
    OPTIONS (table_name 'b_world_fy3e_d');
4.4 查询案例测试
测试环境
| 服务器数 | cpu | 内存 | |
|---|---|---|---|
| UXGIS | 1台 | 4c | 8g |
| Clickhouse | 1台 | 4c | 8g |
测试场景:
-
单点/500点某个时刻查询
---单点 create or replace function query_single(in_lat numeric,in_lon numeric,in_dt numeric) returns table ( datatime numeric, grid_lat numeric, grid_lon numeric, model_dir numeric, model_speed numeric, wind_dir_selected numeric, wind_speed_selected numeric, lat_union_lon varchar(100) ) LANGUAGE pluxsql AS $function$ DECLARE v_lat_lon varchar(100); v_sql text; begin select (st_y(geom)*100)::text||(st_x(geom)*100)::text into v_lat_lon from ( select (st_pixelaspoints(st_clip(a.rast,1,st_setsrid(st_makepoint(in_lon,in_lat),4326),0.05),1,true)).* from ras_world_fy3e a ) foo ; raise notice '%',v_lat_lon; v_sql = 'select datatime,grid_lat,grid_lon,model_dir,model_speed,wind_dir_selected,wind_speed_selected,lat_union_lon from b_world_fy3e_d3 where datatime =$1 and lat_union_lon = $2'; raise notice '%',v_sql; return query execute v_sql using in_dt,v_lat_lon; END; $function$; ---500点 create or replace function query_multi(in_dt numeric) returns table ( datatime numeric, grid_lat numeric, grid_lon numeric, model_dir numeric, model_speed numeric, wind_dir_selected numeric, wind_speed_selected numeric, lat_union_lon varchar(100) ) LANGUAGE pluxsql AS $function$ DECLARE v_lat_lon varchar[]; v_sql text; begin select array_agg((st_y(geom)*100)::text||(st_x(geom)*100)::text) into v_lat_lon from ( select (st_pixelaspoints(st_clip(a.rast,1,b.geom,0.05),1,true)).* from ras_world_fy3e a ,gis_point b ) foo ; raise notice '%',v_lat_lon; v_sql = 'select datatime,grid_lat,grid_lon,model_dir,model_speed,wind_dir_selected,wind_speed_selected,lat_union_lon from b_world_fy3e_d3 where datatime =$1 and lat_union_lon = any($2)'; raise notice '%',v_sql; return query execute v_sql using in_dt,v_lat_lon; END; $function$; -
单点/500点连续30天查询返回
--单点 create or replace function query_single_timeinterval(in_lat numeric,in_lon numeric,in_bg numeric,in_end numeric) returns table ( datatime numeric, grid_lat numeric, grid_lon numeric, model_dir numeric, model_speed numeric, wind_dir_selected numeric, wind_speed_selected numeric, lat_union_lon varchar(100) ) LANGUAGE pluxsql AS $function$ DECLARE v_lat_lon varchar(100); v_sql text; begin select (st_y(geom)*100)::text||(st_x(geom)*100)::text into v_lat_lon from ( select (st_pixelaspoints(st_clip(a.rast,1,st_setsrid(st_makepoint(in_lon,in_lat),4326),0.05),1,true)).* from ras_world_fy3e a ) foo ; raise notice '%',v_lat_lon; v_sql = 'select datatime,grid_lat,grid_lon,model_dir,model_speed,wind_dir_selected,wind_speed_selected,lat_union_lon from b_world_fy3e_d3 where datatime >=$1 and datatime<=$2 and lat_union_lon = $3'; raise notice '%',v_sql; return query execute v_sql using in_bg,in_end,v_lat_lon; END; $function$; ---500点 create or replace function query_multi_timeinterval(in_bg numeric,in_end numeric) returns table ( datatime numeric, grid_lat numeric, grid_lon numeric, model_dir numeric, model_speed numeric, wind_dir_selected numeric, wind_speed_selected numeric, lat_union_lon varchar(100) ) LANGUAGE pluxsql AS $function$ DECLARE v_lat_lon varchar[]; v_sql text; begin select array_agg((st_y(geom)*100)::text||(st_x(geom)*100)::text) into v_lat_lon from ( select (st_pixelaspoints(st_clip(a.rast,1,b.geom,0.05),1,true)).* from ras_world_fy3e a ,gis_point b ) foo ; raise notice '%',v_lat_lon; v_sql = 'select datatime,grid_lat,grid_lon,model_dir,model_speed,wind_dir_selected,wind_speed_selected,lat_union_lon from b_world_fy3e_d3 where datatime >=$1 and datatime <=$2 and lat_union_lon = any($3)'; raise notice '%',v_sql; return query execute v_sql using in_bg,in_end,v_lat_lon; END; $function$; -
单点/500点连续30天查询聚合返回
--单点
create or replace function query_single_timeinterval_analyze(in_lat numeric,in_lon numeric,in_bg numeric,in_end numeric)
returns table (
	             lat_union_lon varchar(100),
	             grid_lat numeric,
	             grid_lon numeric,
	             sum_model_dir numeric,
	             avg_model_dir numeric,
	             sum_model_speed numeric,
	             avg_model_speed numeric,
	             sum_wind_dir_selected numeric,
	             avg_wind_dir_selected numeric,
	             sum_wind_speed_selected numeric,
	             avg_wind_speed_selected numeric
               )
    LANGUAGE pluxsql
AS
$function$
DECLARE
v_lat_lon varchar(100);
v_sql text;
begin
select (st_y(geom)*100)::text||(st_x(geom)*100)::text into v_lat_lon from (
select (st_pixelaspoints(st_clip(a.rast,1,st_setsrid(st_makepoint(in_lon,in_lat),4326),0.05),1,true)).* from ras_world_fy3e a
) foo ;
raise notice '%',v_lat_lon;
v_sql = 'select lat_union_lon,grid_lat,grid_lon,sum(model_dir),avg(model_dir),sum(model_speed),avg(model_speed),sum(wind_dir_selected),avg(wind_dir_selected),sum(wind_speed_selected),avg(wind_speed_selected) from b_world_fy3e_d3 where datatime >=$1 and datatime<=$2 and lat_union_lon = $3 group by lat_union_lon,grid_lat,grid_lon';
raise notice '%',v_sql;
return query execute v_sql using in_bg,in_end,v_lat_lon;
END;
$function$;

--500点
create or replace function query_multi_timeinterval_analyze(in_bg numeric,in_end numeric)
returns table (
	             lat_union_lon varchar(100),
	             grid_lat numeric,
	             grid_lon numeric,
	             sum_model_dir numeric,
	             avg_model_dir numeric,
	             sum_model_speed numeric,
	             avg_model_speed numeric,
	             sum_wind_dir_selected numeric,
	             avg_wind_dir_selected numeric,
	             sum_wind_speed_selected numeric,
	             avg_wind_speed_selected numeric
               )
    LANGUAGE pluxsql
AS
$function$
DECLARE
v_lat_lon varchar[];
v_sql text;
begin
select array_agg((st_y(geom)*100)::text||(st_x(geom)*100)::text) into v_lat_lon from (
select (st_pixelaspoints(st_clip(a.rast,1,b.geom,0.05),1,true)).* from ras_world_fy3e a ,gis_point b
) foo ;
raise notice '%',v_lat_lon;
v_sql = 'select lat_union_lon,grid_lat,grid_lon,sum(model_dir),avg(model_dir),sum(model_speed),avg(model_speed),sum(wind_dir_selected),avg(wind_dir_selected),sum(wind_speed_selected),avg(wind_speed_selected) from b_world_fy3e_d3 where datatime >=$1 and datatime<=$2 and lat_union_lon = any($3) group by lat_union_lon,grid_lat,grid_lon';
raise notice '%',v_sql;
return query execute v_sql using in_bg,in_end,v_lat_lon;
END;
$function$;
结果说明:
| 场景 | 返回行数 | UXGIS+Clickhouse耗时 | UXGIS |
|---|---|---|---|
| 单点时刻查询 | 1 | 0.25s | 0.35s |
| 单点30天查询 | 30 | 0.75s | 0.77s |
| 单点30天聚合 | 1 | 0.52s | 0.73s |
| 500点时刻查询 | 360 | 0.56s | 6.22s |
| 500点30天查询 | 11520 | 1.7s | 3min12.57s |
| 500点30天聚合 | 360 | 1.01s | 3min10s |
五、优缺点
优点:
- 大范围、大数据量的查询效率高
- 分析聚合效率高
- 宽表设计,可以包含多个业务数据,在空间分析上只需做一次
不足:
-
fdw本身存在sql上的限制,比如本地表和外部表做连接不支持条件下推,需要将查询包装成Function.
-
当返回数据量较大时,在网络传输存在时间开销,从上方结果可以看出同条件的查询耗时大于聚合.
-
时间关系,暂未与uxdb mpp作整合对比。
更多推荐

 9
9 0
0- 0


 已为社区贡献1条内容

所有评论(0)