
【Vue3 + SVG 饼图组件单一数据类别显示异常问题】
·
问题描述
在项目统计功能模块中,"章节状态分布"饼图存在显示异常问题:
- ❌ 单状态场景:当统计数据仅包含单个状态类别时,饼图显示错误
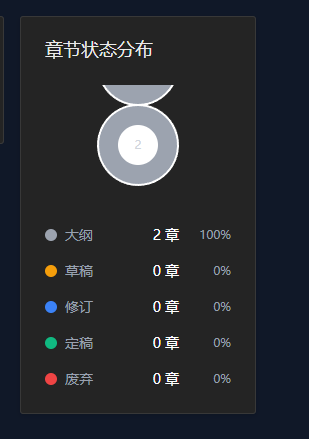
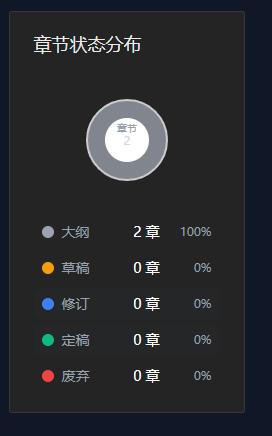
- ✅ 多状态场景:当统计数据包含两个及以上状态类别时,饼图显示正常
问题定位
1. 代码分析
问题出现在 src/views/ProjectStatsDashboard.vue 文件中的饼图路径计算逻辑。
关键代码片段(修复前):
const pieChartPaths = computed(() => {
  // ... 省略其他代码

  if (Math.abs(angle - 360) < 0.01) {
    // Full circle - handle edge case with two semicircles
    return {
      status: item.status,
      d: `M ${pieChartCenter} ${pieChartCenter - pieChartRadius}
                A ${pieChartRadius} ${pieChartRadius} 0 1 1 ${pieChartCenter - 0.01} ${pieChartCenter - pieChartRadius}
                A ${pieChartRadius} ${pieChartRadius} 0 1 1 ${pieChartCenter} ${pieChartCenter - pieChartRadius}`,
      fill: item.color,
    };
  }
  // ...
});
2. 根本原因分析
当只有单一数据类别时,角度计算为 360度(完整圆),原有的全圆SVG路径绘制逻辑使用了两个半圆的组合方式:
M cx cy
A r r 0 1 1 cx-0.01 cy
A r r 0 1 1 cx cy
这种方式在某些SVG渲染引擎中可能导致渲染异常,原因是:
- 两个连续的
A命令在起点和终点非常接近时可能产生路径重叠或渲染冲突 - 微小的浮点精度误差(如
cx - 0.01)可能导致路径闭合不完整
修复方案
修复内容
修改全圆路径的绘制方式,从双半圆组合改为标准圆形路径指令:
if (Math.abs(angle - 360) < 0.01) {
  // Full circle - use a simple circle path
  return {
    status: item.status,
    d: `M ${pieChartCenter} ${pieChartCenter}
            m 0 -${pieChartRadius}
            a ${pieChartRadius} ${pieChartRadius} 0 1 1 0 ${pieChartRadius * 2}
            a ${pieChartRadius} ${pieChartRadius} 0 1 1 0 -${pieChartRadius * 2}`,
    fill: item.color,
  };
}
修复原理
新的路径指令解析:
| 命令 | 参数 | 说明 |
|---|---|---|
M cx cy |
移动到圆心 | 设置起点为圆心 |
m 0 -r |
相对移动到顶部 | 从圆心向上移动半径距离 |
a r r 0 1 1 0 2r |
顺时针画下半圆 | 从顶部顺时针画到底部 |
a r r 0 1 1 0 -2r |
顺时针画上半圆 | 从底部顺时针回到顶部 |
这种方式确保了:
- 路径从圆心开始,通过相对移动定位到起始点
- 使用两个
a命令分别绘制上下半圆,形成完整闭合路径 - 避免了浮点精度问题,路径端点精确重合
完整修复代码
// src/views/ProjectStatsDashboard.vue

const pieChartPaths = computed(() => {
  const total = totalChapters.value;

  if (total === 0) {
    return [];
  }

  let currentAngle = -90;

  return pieChartData.value
    .filter((item) => item.count > 0)
    .map((item) => {
      const angle = (item.count / total) * 360;
      const startAngle = currentAngle;
      const endAngle = currentAngle + angle;
      currentAngle = endAngle;

      const startRad = (startAngle * Math.PI) / 180;
      const endRad = (endAngle * Math.PI) / 180;

      const x1 = pieChartCenter + pieChartRadius * Math.cos(startRad);
      const y1 = pieChartCenter + pieChartRadius * Math.sin(startRad);
      const x2 = pieChartCenter + pieChartRadius * Math.cos(endRad);
      const y2 = pieChartCenter + pieChartRadius * Math.sin(endRad);

      const largeArc = angle > 180 ? 1 : 0;

      if (Math.abs(angle - 360) < 0.01) {
        // Full circle - use a simple circle path
        return {
          status: item.status,
          d: `M ${pieChartCenter} ${pieChartCenter}
                        m 0 -${pieChartRadius}
                        a ${pieChartRadius} ${pieChartRadius} 0 1 1 0 ${pieChartRadius * 2}
                        a ${pieChartRadius} ${pieChartRadius} 0 1 1 0 -${pieChartRadius * 2}`,
          fill: item.color,
        };
      }

      return {
        status: item.status,
        d: `M ${pieChartCenter} ${pieChartCenter}
                    L ${x1} ${y1}
                    A ${pieChartRadius} ${pieChartRadius} 0 ${largeArc} 1 ${x2} ${y2}
                    Z`,
        fill: item.color,
      };
    });
});
验证测试
测试场景
| 场景 | 测试数据 | 预期结果 | 实际结果 |
|---|---|---|---|
| 空数据 | [] |
显示"暂无章节"提示 | ✅ 通过 |
| 单状态 | [{status: 'draft', count: 5}] |
显示完整圆形,中心显示"5章节" | ✅ 通过 |
| 双状态 | [{status: 'draft', count: 3}, {status: 'final', count: 2}] |
显示两个扇形,比例正确 | ✅ 通过 |
| 多状态 | 5种状态各1章 | 显示5个扇形,比例正确 | ✅ 通过 |
构建验证
npm run build
# ✅ 构建成功,无编译错误
总结
问题根源
SVG全圆路径绘制方式不当,导致单一数据类别场景下饼图无法正确渲染。
修复要点
- 使用标准SVG圆形路径指令替代双半圆组合方式
- 确保路径端点精确重合,避免浮点精度问题
- 保持代码简洁性和可读性
经验教训
- SVG路径绘制需要特别注意边界情况(如完整圆)
- 当使用Arc命令绘制闭合路径时,应确保起点和终点精确匹配
- 测试时应覆盖所有边界场景(空数据、单数据、多数据)
修复时间:2026年5月8日
修复位置:src/views/ProjectStatsDashboard.vue 第136-145行
影响范围:章节状态分布饼图组件
参考链接:
更多推荐

 6
6 0
0- 0


 已为社区贡献19条内容

所有评论(0)