
Vue3 ECharts 使用条形图实现渐变色柱体(左侧显示排名、中间显示名称 + 条形图 + markLine 、右侧显示数值)组件抽离复用,包含图表自适应窗口大小 - 附完整示例
·
ECharts:一个基于 JavaScript 的开源可视化图表库。
目录
1)名称文本 - 设置最小宽度、最大宽度、超出显示...且有悬浮提示显示完整名称
2)ECharts进度条最大值:榜单真实最大值 ×1.2(预留留白空间)
/@/components/ECharts/index.vue
效果
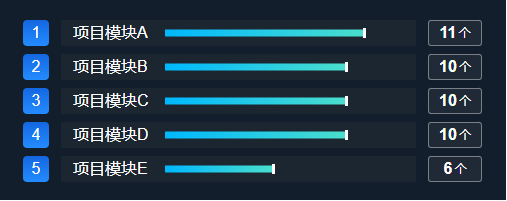
一、介绍
1、官方文档:Apache ECharts
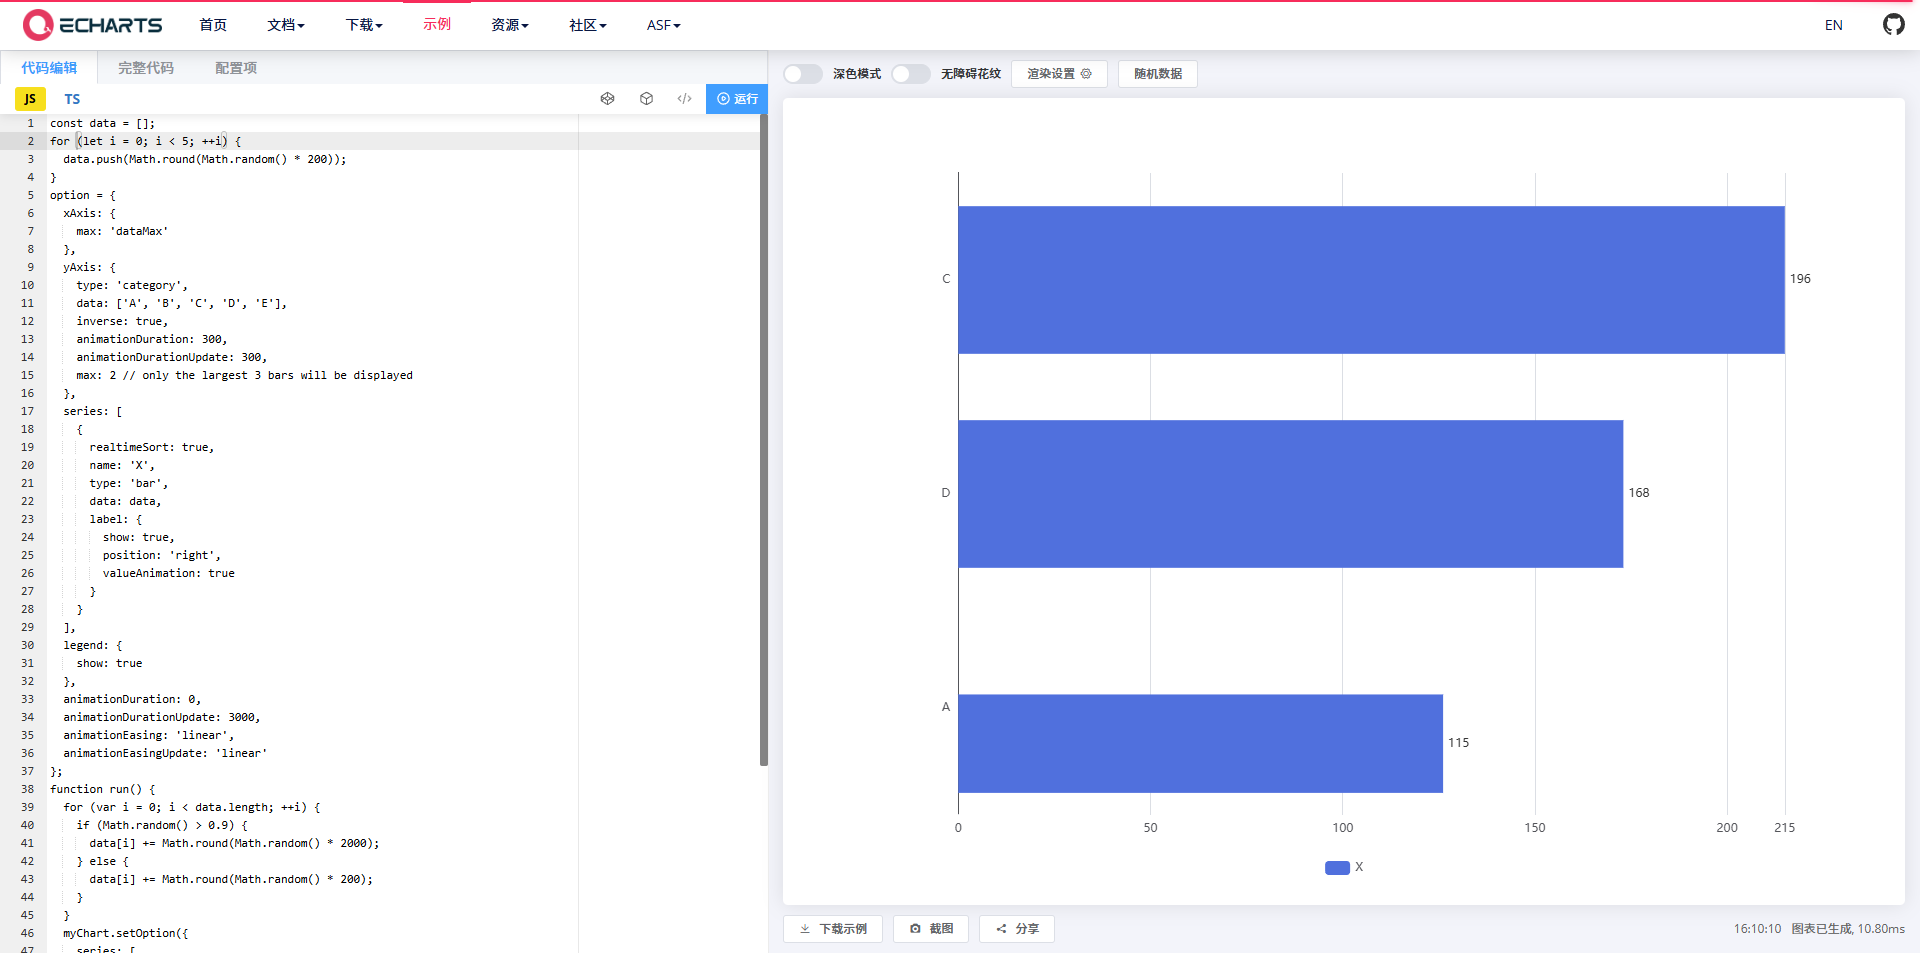
2、官方示例
二、准备工作
1、安装依赖包
npm install echarts --save2、示例版本
"echarts": "^5.6.0",三、使用步骤
1、在单页面引入 ' echarts '
import * as echarts from 'echarts'注:上面的代码会引入 ECharts 中所有的图表和组件,如果你不想引入所有组件,也可以使用 ECharts 提供的按需引入的接口来打包必需的组件。详见官方文档:在项目中引入 ECharts - 入门篇 - Handbook - Apache ECharts
2、指定容器并设置容器宽高
<div class="w-full h-[200px] overflow-hidden flex flex-col gap-2 p-5 bg-[#131E2C]">
  <!-- ECharts进度条容器 -->
  <div class="flex-1 h-[10px] min-w-0">
    <Echarts
      :options="chartOptions[index]"
      :id="`progressChart_${index}_${chartId}`"
      width="100%"
      height="100%"
    />
  </div>
</div>
3、数据处理(关键点)
1)名称文本 - 设置最小宽度、最大宽度、超出显示...且有悬浮提示显示完整名称
<!-- 名称超长悬浮提示 -->
<el-popover
  :content="item.name"
  :effect="popoverEffect"
  :placement="popoverPlacement"
  :width="popoverWidth"
>
  <template #reference>
    <!-- 名称文本 -->
    <div
      class="text-white text-base min-w-[80px] max-w-[120px] shrink-0 overflow-hidden whitespace-nowrap text-ellipsis"
    >
      {{ item.name }}
    </div>
  </template>
</el-popover>
2)ECharts进度条最大值:榜单真实最大值 ×1.2(预留留白空间)
const maxCount = computed(() => {
  const list = props.statisticData?.rankList || []
  if (!list.length) return 1
  // 获取榜单数值最大值
  const originalMax = Math.max(...list.map(item => Number(item.value) || 0))
  return originalMax * 1.2
})
3)隐藏X轴、隐藏Y轴
xAxis: { type: 'value', show: false, max: 100 }, // 隐藏X轴
yAxis: { type: 'category', show: false, data: ['progress'] }, // 隐藏Y轴
4)渐变色进度条
itemStyle: {
  color: new echarts.graphic.LinearGradient(0, 0, 1, 0, [
    { offset: 0, color: '#00b8ff' },
    { offset: 1, color: '#4adecc' }
  ])
},
5)进度条末端白色标记线
markLine: {
  silent: true,
  symbol: 'none',
  data: [{ xAxis: percent }],
  lineStyle: { color: '#fff', width: 3 },
  label: { show: false }
}
四、完整示例
/@/components/ECharts/index.vue
<template>
  <!-- ECharts 渲染容器DOM -->
  <div :id="id" :class="className" ref="chartContainerRef" class="domEle" />
</template>

<script setup lang="ts">
import * as echarts from 'echarts'
import {
  ref,
  defineProps,
  watch,
  onMounted,
  onUnmounted,
  defineEmits,
  markRaw,
  nextTick
} from 'vue'
import { useRouter } from 'vue-router'
import type { ECharts, EChartsOption, EventParams } from 'echarts'
// 引入3D图表依赖
import 'echarts-gl'

// 定义组件自定义事件:图表点击事件
const emit = defineEmits(['click'])
// 路由实例
const router = useRouter()

// ==================== 响应式变量定义 ====================
/** ECharts 实例对象 */
const chartInstance = ref()
/** 自动轮播Tooltip定时器 */
const autoTooltipTimer = ref()
/** 监听容器尺寸变化的观察者实例 */
const resizeObserver = ref()
/** 窗口resize防抖定时器 */
const resizeTimer = ref()
/** 图表渲染容器DOM引用 */
const chartContainerRef = ref()

// ==================== 组件Props定义 ====================
const props = defineProps({
  // ECharts 配置项
  options: {
    type: Object,
    default: () => ({}),
    required: true
  },
  // 容器唯一ID
  id: {
    type: String,
    default: 'chart',
    required: true
  },
  // 自定义类名
  className: {
    type: String,
    default: 'chart'
  },
  // 容器宽度
  width: {
    type: String,
    default: '100%'
  },
  // 容器高度
  height: {
    type: String,
    default: '300px'
  },
  // 点击跳转的路由名称
  clickRouterName: {
    type: String
  },
  // 点击跳转路由携带的参数key
  clickRouterQuery: {
    type: String
  },
  // 是否开启自动轮播Tooltip
  trendsTooltip: {
    type: Boolean,
    default: false
  }
})

// ==================== 核心方法 ====================
/**
 * @description 图表尺寸自适应重绘(防抖处理)
 */
const resize = () => {
  // 清除上一次定时器
  clearTimeout(resizeTimer.value)
  resizeTimer.value = setTimeout(() => {
    // 获取父元素宽高
    const { clientWidth: width, clientHeight: height } = chartContainerRef.value.parentElement
    // 重绘图表
    chartInstance.value.resize({ width, height })
  }, 200)
}

/**
 * @description 初始化ECharts图表
 */
const initChart = () => {
  // 初始化echart
  chartInstance.value = markRaw(echarts.init(chartContainerRef.value))

  // 初始化图表尺寸
  const { clientWidth: width, clientHeight: height } = chartContainerRef.value.parentElement
  chartInstance.value.resize({ width, height })

  // 设置true清空echart缓存
  chartInstance.value.setOption(props.options, true)

  // 配置:图表点击路由跳转
  if (props?.clickRouterName) {
    chartInstance.value.on('click', function (params) {
      const { clickRouterName, clickRouterQuery } = props || {}

      const routeParams = {
        name: clickRouterName,
        query: {}
      } as any

      // 携带路由参数
      if (clickRouterQuery) routeParams.query[clickRouterQuery] = params.name

      // 执行路由跳转
      router.push(routeParams)
    })
  }

  // 图表点击事件,向外抛出
  chartInstance.value.on('click', function (params) {
    emit('click', params)
  })
}

// ==================== 生命周期钩子 ====================
// 页面挂载,开始绘制图表
onMounted(() => {
  nextTick(() => {
    // 初始化图表
    initChart()
    // 创建尺寸观察者,监听图表容器变化
    resizeObserver.value = new ResizeObserver(entries => {
      resize()
    })

    // 传入需要监听的DOM元素
    resizeObserver.value.observe(chartContainerRef.value)
    // 监听窗口大小变化
    window.addEventListener('resize', resize)
  })
})

// 页面卸载,销毁事件和实例
onUnmounted(() => {
  // 取消对所有节点的监听
  resizeObserver.value.disconnect(chartContainerRef.value)
  // 移除窗口resize监听
  window.removeEventListener('resize', resize)

  // 销毁ECharts实例
  chartInstance.value.dispose()
  chartInstance.value = null
  // 清除防抖定时器
  resizeTimer.value && clearTimeout(resizeTimer.value)
  // 清除自动tooltip定时器
  autoTooltipTimer.value && clearTimeout(autoTooltipTimer.value)
})

// ==================== 数据监听 ====================
// 监听图表数据时候变化,重新渲染图表
watch(
  () => props.options,
  () => {
    nextTick(() => {
      initChart()
    })
  },
  { deep: true }
)
</script>

<style scoped>
/* 图表容器默认样式:铺满父元素 */
.domEle {
  width: 100%;
  height: 100%;
}
</style>
chart.vue
<template>
  <!-- 页面根容器 -->
  <div class="w-full h-[200px] overflow-hidden flex flex-col gap-2 p-5 bg-[#131E2C]">
    <!-- 榜单列表循环渲染 -->
    <div class="flex items-center gap-3 px-1" v-for="(item, index) in chartList" :key="item.name">
      <!-- 排名数字方块 -->
      <div
        class="w-[26px] h-[26px] flex items-center justify-center text-white text-[16px] shrink-0 rounded-[4px]"
        style="background: linear-gradient(180deg, #1467e0 0%, #238cff 100%)"
      >
        {{ index + 1 }}
      </div>

      <!-- 名称+进度条容器 -->
      <div class="flex-1 h-[26px] flex items-center gap-3 bg-[rgba(30,40,50,0.8)] px-3 min-w-0">
        <!-- 名称超长悬浮提示 -->
        <el-popover
          :content="item.name"
          :effect="popoverEffect"
          :placement="popoverPlacement"
          :width="popoverWidth"
        >
          <template #reference>
            <!-- 名称文本 -->
            <div
              class="text-white text-base min-w-[80px] max-w-[120px] shrink-0 overflow-hidden whitespace-nowrap text-ellipsis"
            >
              {{ item.name }}
            </div>
          </template>
        </el-popover>

        <!-- ECharts进度条容器 -->
        <div class="flex-1 h-[10px] min-w-0">
          <Echarts
            :options="chartOptions[index]"
            :id="`progressChart_${index}_${chartId}`"
            width="100%"
            height="100%"
          />
        </div>
      </div>

      <!-- 数值展示框 -->
      <div
        class="w-[54px] h-[26px] flex items-center justify-center text-white shrink-0 rounded-[3px]"
        style="background-color: #1f2a36; border: 1px solid rgba(255, 255, 255, 0.4)"
      >
        <span class="text-[16px] font-semibold">{{ item.value }}</span>
        <!-- 单位:小字体展示 -->
        <span class="text-[12px] ml-0.5">个</span>
      </div>
    </div>
  </div>
</template>

<script setup lang="ts">
// 导入Vue核心API
import { ref, computed, onMounted, watch, defineAsyncComponent, defineProps } from 'vue'
// 导入ECharts核心库
import * as echarts from 'echarts'

// ==================== TS类型定义 ====================
// 榜单单项数据类型
interface RankItem {
  name: string // 项目/模块名称
  value: string // 统计数值
}
// 整体统计数据类型
interface StatisticData {
  totalCount?: number | string // 总数量
  currentCount?: number | string // 当前数量
  rankList?: RankItem[] // 榜单数据列表
}

// 异步导入自定义ECharts组件
const Echarts = defineAsyncComponent(() => import('/@/components/ECharts/index.vue'))

// 组件Props定义:接收父组件传递的统计数据
const props = defineProps({
  statisticData: {
    type: Object as () => StatisticData,
    // 默认模拟数据,无传参时使用
    default: () => ({
      totalCount: 48,
      currentCount: 16,
      rankList: [
        { name: '项目模块A', value: '11' },
        { name: '项目模块B', value: '10' },
        { name: '项目模块C', value: '10' },
        { name: '项目模块D', value: '10' },
        { name: '项目模块E', value: '6' }
      ]
    })
  }
})

// ==================== 全局配置 ====================
// 悬浮提示框配置
const popoverEffect = ref('dark')
const popoverPlacement = ref('top')
const popoverWidth = ref(150)
// 图表唯一ID(防止重复)
const chartId = ref('progressChart_' + Date.now())
// 存储所有进度条的配置项
const chartOptions = ref<echarts.EChartsOption[]>([])

// ==================== 计算属性 ====================
// 处理榜单数据:最多展示5条
const chartList = computed(() => (props.statisticData.rankList || []).slice(0, 5))

// 计算进度条最大值:榜单真实最大值 ×1.2(预留留白空间)
const maxCount = computed(() => {
  const list = props.statisticData?.rankList || []
  if (!list.length) return 1
  // 获取榜单数值最大值
  const originalMax = Math.max(...list.map(item => Number(item.value) || 0))
  return originalMax * 1.2
})

// ==================== 核心方法 ====================
/**
 * @description 初始化所有进度条图表
 * 计算每个条目的百分比,生成ECharts配置
 */
const initProgressCharts = () => {
  const list = chartList.value
  // 无数据时直接返回
  if (!list.length) return

  // 遍历数据生成图表配置
  const options = list.map(item => {
    // 计算当前数值占最大值的百分比
    const percent = (Number(item.value) / maxCount.value) * 100
    return {
      backgroundColor: 'transparent', // 透明背景
      animation: false, // 关闭动画
      // 清空图表边距
      grid: { left: 0, right: 0, top: 0, bottom: 0, containLabel: false },
      xAxis: { type: 'value', show: false, max: 100 }, // 隐藏X轴
      yAxis: { type: 'category', show: false, data: ['progress'] }, // 隐藏Y轴
      series: [
        {
          type: 'bar',
          data: [percent],
          barHeight: '100%',
          // 渐变色进度条
          itemStyle: {
            color: new echarts.graphic.LinearGradient(0, 0, 1, 0, [
              { offset: 0, color: '#00b8ff' },
              { offset: 1, color: '#4adecc' }
            ])
          },
          // 进度条末端白色标记线
          markLine: {
            silent: true,
            symbol: 'none',
            data: [{ xAxis: percent }],
            lineStyle: { color: '#fff', width: 3 },
            label: { show: false }
          }
        }
      ]
    }
  })
  // 赋值图表配置
  chartOptions.value = options
}

// ==================== 生命周期 & 数据监听 ====================
// 页面挂载后初始化图表
onMounted(() => initProgressCharts())

// 深度监听数据变化,自动更新图表
watch(
  () => props.statisticData,
  () => initProgressCharts(),
  { deep: true }
)
</script>

<style lang="scss" scoped></style>
注:文本使用了CSS框架 - Tailwind CSS,可参考这里哦https://blog.csdn.net/m0_48968874/article/details/153179400?spm=1001.2014.3001.5501
欢迎关注微:【前端小知识营地】
更多推荐


 5
5 0
0- 0


 已为社区贡献5条内容

所有评论(0)