如何在 Python 中重塑 networkx 图?
回答问题
所以我创建了一种非常幼稚(可能效率低下)的生成哈希图的方法。
问题:
我有 4 个维度... p q r s 。
我想统一显示它(tesseract),但我不知道如何重塑它。 如何在 Python 中重塑 networkx 图?
我见过一些使用spring_layout()和draw_circular()的人的例子,但它并没有按照我正在寻找的方式塑造,因为它们不统一。
有没有办法重塑我的图表并使其统一?(即将我的哈斯图重塑为正方体形状(最好使用nx.draw())
这是我目前的样子: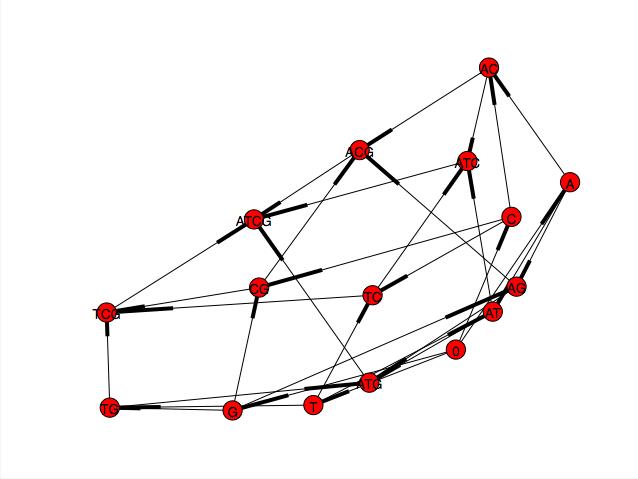
这是我生成 N 维哈希图的代码
#!/usr/bin/python

import networkx as nx
import matplotlib.pyplot as plt
import itertools

H = nx.DiGraph()

axis_labels = ['p','q','r','s']

D_len_node = {}

#Iterate through axis labels
for i in xrange(0,len(axis_labels)+1):
    #Create edge from empty set
    if i == 0:
        for ax in axis_labels:
            H.add_edge('O',ax)
    else:
        #Create all non-overlapping combinations
        combinations = [c for c in itertools.combinations(axis_labels,i)]
        D_len_node[i] = combinations
    #Create edge from len(i-1) to len(i) #eg. pq >>> pqr, pq >>> pqs
    if i > 1:
        for node in D_len_node[i]:
            for p_node in D_len_node[i-1]:
                #if set.intersection(set(p_node),set(node)): Oops
                if all(p in node for p in p_node) == True: #should be this!
                    H.add_edge(''.join(p_node),''.join(node))

#Show Plot
nx.draw(H,with_labels = True,node_shape = 'o')
plt.show()
我想像这样重塑它: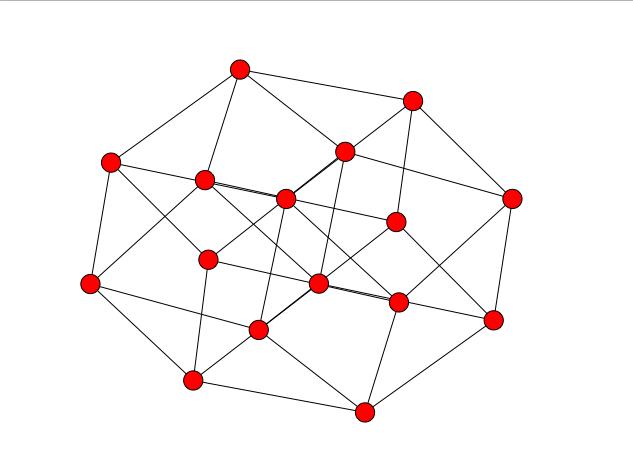
如果有人知道制作哈斯图的更简单方法,请分享一些智慧,但这不是本文的主要目的。
Answers
这是一个务实的,而不是纯粹的数学答案。
我认为您有两个问题 - 一个与布局有关,另一个与您的网络有关。
1.网络
您的网络中有太多边,无法代表单位 tesseract。 Caveat 我不是这里的数学专家 - 只是从绘图角度(matplotlib 标签)得出这个结论。请解释我是否错了。
您想要的投影,例如,nu003d4 的哈斯图的wolfram mathworld页面只有 4 条边连接所有节点,而 2 位节点有 6 条边,3 位节点有 7 条边。您的图表完全连接每个“级别”,即具有 0 个1值的 4-D 向量连接到具有 1 个1值的所有向量,然后连接到具有 2 个1值的所有向量,依此类推。这在基于维基百科答案的投影中最为明显(下图第二张)
2.投影
我找不到预先编写的算法或库来自动将 4D tesseract 投影到 2D 平面上,但我确实找到了几个示例,例如。维基百科。由此,您可以计算出适合您的坐标集并将其传递给nx.draw()调用。
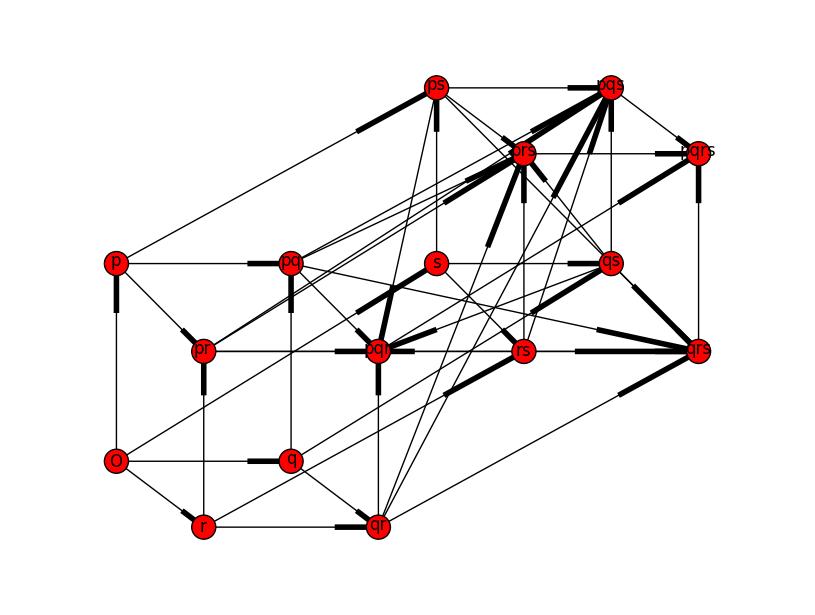
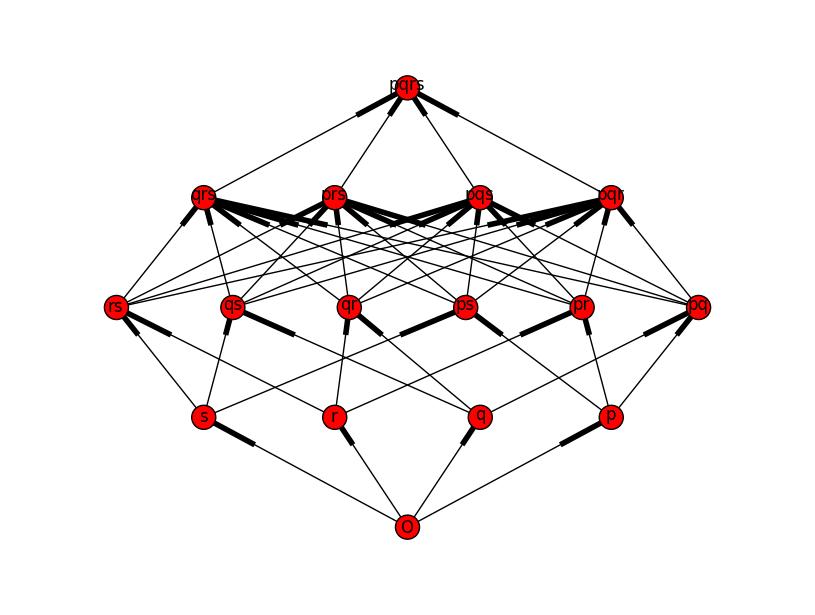
这是一个例子 - 我已经包含了两个坐标集,一个看起来像你上面显示的投影,一个匹配这个来自维基百科。
import networkx as nx
import matplotlib.pyplot as plt
import itertools

H = nx.DiGraph()

axis_labels = ['p','q','r','s']

D_len_node = {}

#Iterate through axis labels
for i in xrange(0,len(axis_labels)+1):
    #Create edge from empty set
    if i == 0:
        for ax in axis_labels:
            H.add_edge('O',ax)
    else:
        #Create all non-overlapping combinations
        combinations = [c for c in itertools.combinations(axis_labels,i)]
        D_len_node[i] = combinations
    #Create edge from len(i-1) to len(i) #eg. pq >>> pqr, pq >>> pqs
    if i > 1:
        for node in D_len_node[i]:
            for p_node in D_len_node[i-1]:
                if set.intersection(set(p_node),set(node)):
                    H.add_edge(''.join(p_node),''.join(node))

#This is manual two options to project tesseract onto 2D plane
# - many projections are available!!
wikipedia_projection_coords = [(0.5,0),(0.85,0.25),(0.625,0.25),(0.375,0.25),
                                (0.15,0.25),(1,0.5),(0.8,0.5),(0.6,0.5),
                                (0.4,0.5),(0.2,0.5),(0,0.5),(0.85,0.75),
                                (0.625,0.75),(0.375,0.75),(0.15,0.75),(0.5,1)]

#Build the "two cubes" type example projection co-ordinates
half_coords = [(0,0.15),(0,0.6),(0.3,0.15),(0.15,0),
               (0.55,0.6),(0.3,0.6),(0.15,0.4),(0.55,1)]
#make the coords symmetric
example_projection_coords = half_coords + [(1-x,1-y) for (x,y) in half_coords][::-1]

print example_projection_coords


def powerset(s):
    ch = itertools.chain.from_iterable(itertools.combinations(s, r) for r in range(len(s)+1))
    return [''.join(t) for t in ch]

pos={}
for i,label in enumerate(powerset(axis_labels)):
    if label == '':
       label = 'O'
    pos[label]= example_projection_coords[i]

#Show Plot
nx.draw(H,pos,with_labels = True,node_shape = 'o')
plt.show()
注意 - 除非您更改我在上面 1. 中提到的内容,否则它们仍然具有您的边缘结构,因此看起来与网络上的示例不完全相同。这是您现有的网络生成代码的样子 - 如果您将其与您的示例进行比较,您可以看到额外的边缘(例如,我不应该将这个pr连接到pqs:
'两个立方体' 投影
维基媒体示例投影
zoz100036 * *
备注
如果您想深入了解自己的预测(并在数学上构建pos),您可以查看这篇研究论文。
zoz100037 * *
编辑:
好奇心战胜了我,我不得不寻找一种数学方法来做到这一点。我发现这个博客- 其主要结果是投影矩阵:
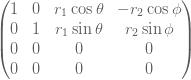
这导致我开发了这个函数来投影每个标签,将包含“p”的标签表示该点在“p”轴上的值为 1,即我们正在处理单位 tesseract。因此:
def construct_projection(label):
    r1 = r2 = 0.5
    theta = math.pi / 6
    phi = math.pi / 3
    x = int( 'p' in label) + r1 * math.cos(theta) * int('r' in label) - r2 * math.cos(phi) * int('s' in label)
    y = int( 'q' in label) + r1 * math.sin(theta) * int('r' in label) + r2 * math.sin(phi) * int('s' in label)
    return (x,y)
对所有点都不同的常规 2D 八边形进行很好的投影。
这将在上面的程序中运行,只需替换
pos[label] = example_projection_coords[i]
和
pos[label] = construct_projection(label)
这给出了结果:
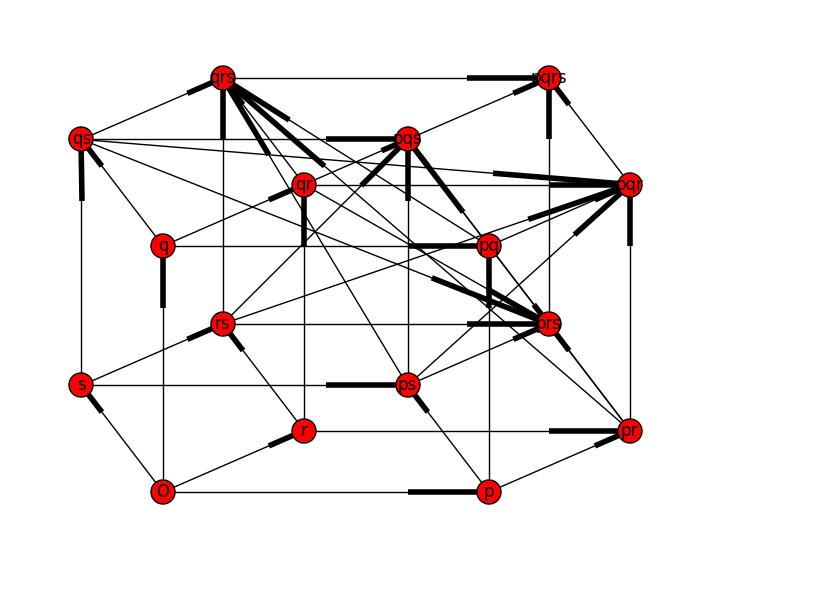
尽情玩r1,r2,theta和phi:)

Python社区为您提供最前沿的新闻资讯和知识内容
更多推荐

 0
0 0
0- 0


 已为社区贡献126440条内容

所有评论(0)