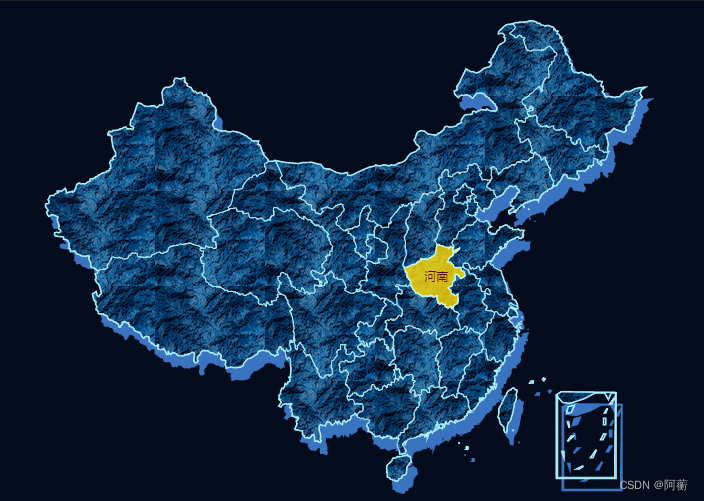
vue3中使用echarts实现自定义纹理3d地图
代码】vue3中使用echarts实现自定义纹理3d地图。
·
- 效果图

- npm下载echarts,在main文件中全局引入
npm install echarts -S
import * as Echarts from 'echarts'
app.config.globalProperties.$Echarts = Echarts;
- vue文件中template
<div class="container">
    <img ref="dot" hidden src="../assets/map-bg.png">
    <div id="map" ref="map" style="height: 500px;"></div>
</div>
- 通过阿里云数据可视化平台下载获取geoJson数据文件,在vue文件中引入该数据文件
import "echarts/map/js/china.js";
- 实现直接贴代码
import { getCurrentInstance, ref } from 'vue';
// 获取当前组件实例下的proxy
const { proxy } = getCurrentInstance();
// 通过ref获取dom元素
const dot = ref(null)

const map = ref(null);

let myChart = proxy.$Echarts.init(document.getElementById('map'));
let options = {
    backgroundColor: "#040b1c",
    geo: {
        map: 'china',
        type: 'map',
        layoutCenter: ['50%', '50%'],
        layoutSize: '120%',
        zoom: 1,
        roam: false,
        itemStyle: {
            borderColor: '#AEF3FF',
            borderWidth: 2,
            areaColor: {
                image: dot.value,
                repeat: 'repeat'
            },
            shadowColor: 'rgb(58,115,192)',
            shadowOffsetX: 6,
            shadowOffsetY: 12
        }
    },
    series: [
        {
            type: 'map',
            map: 'china',
            layoutCenter: ['50%', '50%'],
            layoutSize: '120%',
            zoom: 1,
            roam: false,
            itemStyle: {
                borderColor: '#AEF3FF',
                borderWidth: 1,
                areaColor: {
                    image: dot.value,
                    repeat: 'repeat'
                },
            }
        }
    ]
}
myChart.setOption(options);
window.onresize = () => {
    myChart.resize()
}
更多推荐
 已为社区贡献6条内容


所有评论(0)