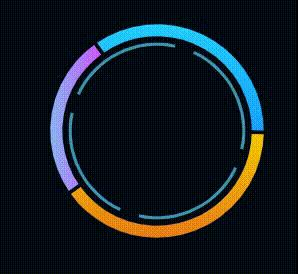
ECharts之 饼图 Pie -- 旋转动画
echarts 之 Pie – 旋转动画在vue中的template<div class="pie-chart-wra"><div ref="PieChart" :style="{ width: '100%', height: height }"></div></div>
·
echarts 之 饼图 Pie – 旋转动画
npm install echarts --save
在vue中的template
 <div class="pie-chart-wra">
        <div ref="PieChart" :style="{ width: '100%', height: height }"></div>
 </div>
script中 – javascript
import echarts from 'echarts' //引入echarts
  props:{
	 height: { type: String, default: '310px' },
	 bgColor: { type: String, default: 'rgb(2,9,18)' },
  },
  data() {
        return {  myChart: null, option:null };
    },
    mounted() {
        this.$nextTick(() => {
            this.drawChart();
            this.timer = setInterval(() => {
                this.doing();
            }, 200);
        });
    },
  methods: {
     drawChart() {
		this.myChart = echarts.init(this.$refs.PieChart);
		this.option = {
			backgroundColor:this.bgColor,
			series:[
				{
				  type:'pie',
				  zlevel:1, //所有图形的 zlevel 值。zlevel 大的 Canvas 会放在 zlevel 小的 Canvas 的上面
				  startAngle:90, //默认90,起始角度,支持范围[0, 360]
				  radius:['70%','80%'], //数组的第一项是内半径,第二项是外半径 -- 圆环
				  label:{show:false}, //文本标签,可用于说明图形的一些数据信息
				  labelLine:{show:false}, //标签的视觉引导线配置


				},
				{
	                type: 'pie,
	                zlevel: 2,
	                silent: true, //图形是否不响应和触发鼠标事件,默认为 false,即响应和触发鼠标事件
	                startAngle: 360,
	                radius:['60%','68%'],
	                label: { show: false },
	                labelLine: { show: false },
	                data: this._pie(),
	                animation: false, //是否开启动画
                 }
			]
		};
	},
	 _pie() {
            let dataArr = [];
            for (var i = 0; i < 8; i++) {
                if (i % 2 === 0) {
                    dataArr.push({
                        name: (i + 1).toString(),
                        value: 60,
                        itemStyle: {
                            color: 'rgb(63,150,175)',
                            borderWidth: 0,
                            borderColor: this.bgColor,
                        },
                    });
                } else {
                    dataArr.push({
                        name: (i + 1).toString(),
                        value: 10,
                        itemStyle: {
                            color: this.bgColor,
                            borderWidth: 0,
                            borderColor: this.bgColor,
                        },
                    });
                }
            }
            return dataArr;
        },
	doing() {
            this.option.series[0].startAngle = this.option.series[0].startAngle - 5;
            this.option.series[1].startAngle = this.option.series[1].startAngle - 5;
            this.myChart.setOption(this.option);
        },
 }
更多推荐
 已为社区贡献1条内容


所有评论(0)