Drawio二次开发与接入Vue项目
二次开发drawioweb端并接入vue项目中使用
1.github上clone Drawio项目
drawio github地址:https://github.com/jgraph/drawio2.项目导入vscode并部署

1.部署drawio
这里使用的是nginx代理本地部署,只需要代理drawio\src\main\webapp目录即可,下面贴上nginx配置文件 nginx.conf
worker_processes  1;

events {
    worker_connections  1024;
}


http {
    include       mime.types;
    default_type  application/octet-stream;

    sendfile        on;
    #tcp_nopush     on;

    #keepalive_timeout  0;
    keepalive_timeout  65;

    #gzip  on;

    server {
        listen       88;
        server_name  localhost;

        location /drawio {
                alias D:\drawio\drawio\src\main\webapp;  # 设置静态文件目录的路径
                index index.html index.htm;  # 设置默认的索引文件
                try_files $uri $uri/ /index.html;  # 尝试查找文件,如果文件不存在则返回index.html
        }

            #error_page  404              /404.html;
            error_page   500 502 503 504  /50x.html;
            location = /50x.html {
                root   html;
            }
    }
}
2.访问项目
浏览器访问http://localhost:88/drawio/

3.修改代码
根据项目需求,需要自定义侧边栏的菜单,把不常用的图形去掉,提取需要使用到的图形并且归类,自定义标题与提示,移除分享按钮等不需要使用的功能
放一张修改后的图

1.设置调用本地资源
关于修改代码后没有变化的问题,需要在链接后面拼接参数dev=1,也就是访问http://localhost:88/drawio?dev=1进入开发模式才能看到效果。因为正常访问webapp加载的js都是原版打包的js,而我们现在修改的js是没有通过ant打包的。
所以我们在开始修改代码前需要设置调用本地资源,修改index.html代码,大概在222行左右的位置。找不到可以用ctrl+f搜索相关代码

// 调用本地资源
			if (location.hostname == 'localhost' || location.hostname == '127.0.0.1') {
				drawDevUrl = document.location.protocol + '//localhost:88/drawioMain/webapp/';
				geBasePath = drawDevUrl + '/js/grapheditor';
				mxBasePath = drawDevUrl + '/mxgraph';
				mxForceIncludes = true
			}
这样的话在dev模式下调用的js就是本地资源了 ,修改代码后刷新页面就可以看到效果了。
留意MD5校验
在diagramly/App.js文件大约第713行的位置有一处以hardcode方式对代码进行的校验。
if (CryptoJS.MD5(content).toString() != '94ebd7472449efab95e00746ea00db60')
如果你修改了项目代码中的任何部分,在打开页面时就会出现“Bootstrap script change requires update of CSP”的弹窗提示。所以在你修改完所有代码后,在此处可以从console.log中看一下CryptoJS.MD5(content).toString()的MD5值是什么,替换到等号右边就可以了。
2.把不常用的图形隐藏

按照需求,这几个是需要隐藏的,通过分析源码结构,发现了初始化左侧图形模板的地方在drawio\src\main\webapp\js\diagramly\sidebar\Sidebar.js中。大概在842行左右的位置
例如:第一个General,对应的方法就是addGeneralPalette,把这一行注释掉就不会显示了

以此类推注释就可以把其它默认的图形隐藏

3.自定义图形并分组
通过代码可以发现,每个图形模块方法都是挂载在Sidebar.prototype上的,而每个图形具体的样式代码可以参考 drawio\src\main\webapp\js\diagramly\sidebar 下的Sidebar-xxx.js 来自定义一份。可以从其它sidebarjs中提取出想要的模型
以第一个General为例子:drawio\src\main\webapp\js\grapheditor\Sidebar.js 1349行左右
Sidebar.prototype.addGeneralPalette = function(expand)
{
	...
	var fns = [
	//这个数组中就是各个图形,把不想保留的注释掉即可。有以下两种形式
	this.createEdgeTemplateEntry(...);
	this.addEntry(...);

	];
	...
}
1.创建Sidebar-xxx.js文件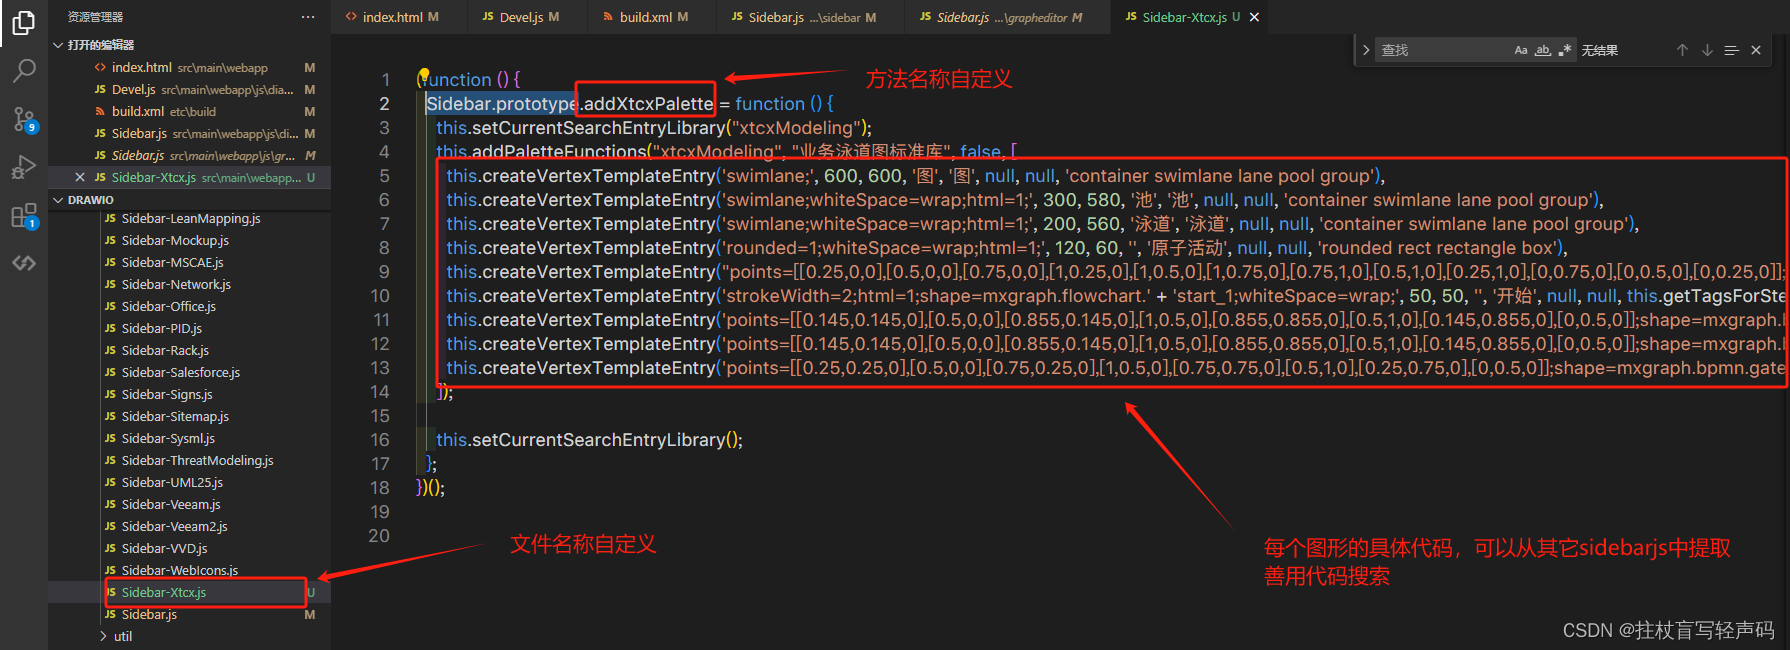
Sidebar-Xtcx.js
(function () {
  Sidebar.prototype.addXtcxPalette = function () {
    this.setCurrentSearchEntryLibrary("xtcxModeling");
    this.addPaletteFunctions("xtcxModeling", "业务泳道图标准库", false, [
      this.createVertexTemplateEntry('swimlane;', 600, 600, '图', '图', null, null, 'container swimlane lane pool group'),
      this.createVertexTemplateEntry('swimlane;whiteSpace=wrap;html=1;', 300, 580, '池', '池', null, null, 'container swimlane lane pool group'),
      this.createVertexTemplateEntry('swimlane;whiteSpace=wrap;html=1;', 200, 560, '泳道', '泳道', null, null, 'container swimlane lane pool group'),
      this.createVertexTemplateEntry('rounded=1;whiteSpace=wrap;html=1;', 120, 60, '', '原子活动', null, null, 'rounded rect rectangle box'),
      this.createVertexTemplateEntry("points=[[0.25,0,0],[0.5,0,0],[0.75,0,0],[1,0.25,0],[1,0.5,0],[1,0.75,0],[0.75,1,0],[0.5,1,0],[0.25,1,0],[0,0.75,0],[0,0.5,0],[0,0.25,0]];shape=mxgraph.bpmn.task;whiteSpace=wrap;rectStyle=rounded;size=10;html=1;container=1;expand=0;collapsible=0;taskMarker=abstract;isLoopSub=1;", 120, 80, "", "复合活动", null, null, "bpmn business process model notation task sub process subprocess collapsed"),
      this.createVertexTemplateEntry('strokeWidth=2;html=1;shape=mxgraph.flowchart.' + 'start_1;whiteSpace=wrap;', 50, 50, '', '开始', null, null, this.getTagsForStencil('mxgraph.flowchart', 'start_1', '').join(' ')),
      this.createVertexTemplateEntry('points=[[0.145,0.145,0],[0.5,0,0],[0.855,0.145,0],[1,0.5,0],[0.855,0.855,0],[0.5,1,0],[0.145,0.855,0],[0,0.5,0]];shape=mxgraph.bpmn.event;html=1;verticalLabelPosition=bottom;labelBackgroundColor=#ffffff;verticalAlign=top;align=center;perimeter=ellipsePerimeter;outlineConnect=0;aspect=fixed;outline=' + 'end;symbol=terminate2;', 50, 50, '', '结束', null, null, 'end'),
      this.createVertexTemplateEntry('points=[[0.145,0.145,0],[0.5,0,0],[0.855,0.145,0],[1,0.5,0],[0.855,0.855,0],[0.5,1,0],[0.145,0.855,0],[0,0.5,0]];shape=mxgraph.bpmn.event;html=1;verticalLabelPosition=bottom;labelBackgroundColor=#ffffff;verticalAlign=top;align=center;perimeter=ellipsePerimeter;outlineConnect=0;aspect=fixed;outline=' + 'catching;symbol=message;', 50, 50, '', "中间事件(消息)", null, null, 'message intermediate catching'),
      this.createVertexTemplateEntry('points=[[0.25,0.25,0],[0.5,0,0],[0.75,0.25,0],[1,0.5,0],[0.75,0.75,0],[0.5,1,0],[0.25,0.75,0],[0,0.5,0]];shape=mxgraph.bpmn.gateway2;html=1;verticalLabelPosition=bottom;labelBackgroundColor=#ffffff;verticalAlign=top;align=center;perimeter=rhombusPerimeter;outlineConnect=0;outline=' + 'none;symbol=none;', 40, 40, '', '判断', null, null, 'exclusive'),
    ]);

    this.setCurrentSearchEntryLibrary();
  };
})();
2.注册自定义模板组
drawio\src\main\webapp\js\diagramly\Devel.js 
// 注册自定义模板组
mxscript(drawDevUrl + 'js/diagramly/sidebar/Sidebar-Xtcx.js');
3.初始化自定义模板组
src\main\webapp\js\diagramly\sidebar\Sidebar.js
想要让自定义模板组显示在左侧菜单中需要到这个位置初始化 
到这里保存dev模式下在浏览器上就可以看到精简自定义后的页面了
4.打包部署
改完代码肯定是要打包部署的,不可能生产环境还用dev开发模式访问。
这里打包需要用到 apache-ant 工具
apacheAnt https://ant.apache.org/bindownload.cgi具体怎么安装可以搜一下
打包前需要将我们自定义的js加入打包目录
修改build.xml drawio\etc\build\build.xml 大概在112行左右
开始打包:
cd到drawio\etc\build目录 ant

打包完成后可以单独压缩webapp目录来部署drawio,nginx部署后不需要进入dev模式就能看到修改的效果了
3.接入Vue项目
推荐使用GitHub上大佬写的库:drawio-embedhttps://github.com/imaoda/drawio-embed
开箱即用 
使用起来比较简单这里就不赘述了,我是在全局挂载这个opendrawio方法,需要触发打开绘制时就调用这个方法,然后监听绘制层保存后返回的数据,拿到数据后就可以调接口存到数据库中,当用户需要修改时同理:调用接口拿到保存的xml文本通过传参的方式传到openDrawio方法里面打开iframe绘制层绘制。
就写到这里吧,欢迎大家留言讨论

前往低代码交流专区
更多推荐


 35
35 0
0- 0


 已为社区贡献1条内容

所有评论(0)