flutter自定义系列之简单的K线图绘制
可左右滑动,可伸缩,仅包含基本功能,真正的需要分时图,各种的指标,甚至是自定义的指标绘制等等,你可以根据需求进一步完善和优化。技术人日拱一卒,共勉!
·
上篇文章讲了flutter自定义的相关流程,
今天继续练习下flutter的自定义K线:
我们可以通过自定义Painter来实现一个简单的K线图界面:
- 创建一个自定义的Painter,用于绘制K线图:
import 'dart:ui';

import 'package:flutter/material.dart';

class KLinePainter extends CustomPainter {
  final List<dynamic> data;
  final double itemWidth;
  final double scaleFactor;

  KLinePainter({required this.data, required this.itemWidth, required this.scaleFactor});

  @override
  void paint(Canvas canvas, Size size) {
    // 设置画笔
    final linePaint = Paint()
      ..color = Colors.grey
      ..strokeWidth = 0.5;

    final textPainter = TextPainter(textDirection: TextDirection.ltr, textAlign: TextAlign.left);

    // 计算价格范围和最大成交量
    num highestPrice = double.minPositive;
    num lowestPrice = double.maxFinite;
    num highestVolume = double.minPositive;

    for (var item in data) {
      if (item['high'] > highestPrice) {
        highestPrice = item['high'];
      }
      if (item['low'] < lowestPrice) {
        lowestPrice = item['low'];
      }
      if (item['vol'] > highestVolume) {
        highestVolume = item['vol'];
      }
    }

    // 计算价格和成交量的缩放比例
    double priceScale = (size.height - 20) / (highestPrice - lowestPrice);
    double volumeScale = size.height * 0.2 / highestVolume;

    // 绘制K线图
    for (int i = 0; i < data.length; i++) {
      var item = data[i];

      double open = (item['open'] - lowestPrice) * priceScale;
      double close = (item['close'] - lowestPrice) * priceScale;
      double high = (item['high'] - lowestPrice) * priceScale;
      double low = (item['low'] - lowestPrice) * priceScale;
      double vol = item['vol'] * volumeScale;

      // 设置画笔颜色
      linePaint.color = close >= open ? Colors.green : Colors.red;

      // 绘制实体
      double halfWidth = itemWidth * scaleFactor / 2;
      double centerX = i * itemWidth * scaleFactor + halfWidth;
      canvas.drawRect(
        Rect.fromCenter(
          center: Offset(centerX, size.height - (open + close) / 2 - 10),
          width: itemWidth * scaleFactor,
          height: (open - close).abs(),
        ),
        linePaint,
      );

      // 绘制上下影线
      canvas.drawLine(Offset(centerX, size.height - high - 10), Offset(centerX, size.height - low - 10), linePaint);
    }
  }

  @override
  bool shouldRepaint(CustomPainter oldDelegate) {
    return true;
  }
}
- 创建一个StatefulWidget,用于处理缩放和滚动:
class KLineChart extends StatefulWidget {
  final List<dynamic> data;

  KLineChart({required this.data});

  @override
  _KLineChartState createState() => _KLineChartState();
}

class _KLineChartState extends State<KLineChart> {
  double _scaleFactor = 1.0;
  double _itemWidth = 10.0;
  late double _baseScaleFactor;

  @override
  void initState() {
    super.initState();
    _baseScaleFactor = _scaleFactor;
  }

  @override
  Widget build(BuildContext context) {
    return GestureDetector(
      onScaleStart: (details) {
        _baseScaleFactor = _scaleFactor;
      },
      onScaleUpdate: (details) {
        setState(() {
          // 修改这里,减小缩放速度
          _scaleFactor = _baseScaleFactor * (1.0 + (details.scale - 1.0) / 2);
        });
      },
      child: SingleChildScrollView(
        scrollDirection: Axis.horizontal,
        child: CustomPaint(
          size: Size(widget.data.length * _itemWidth * _scaleFactor, MediaQuery.of(context).size.height),
          painter: KLinePainter(data: widget.data, itemWidth: _itemWidth, scaleFactor: _scaleFactor),
        ),
      ),
    );
  }
}
- 在需要使用K线图的地方,调用
KLineChart组件并传入K线数据:
List<dynamic> kLineData = [
  // 你的K线数据
];

KLineChart(data: kLineData);
这样,你就可以实现一个简单的可左右滑动、放大缩小的K线界面。
这里我们看看实现的效果:
我先模拟了一些K线数据:
List<dynamic> generateKLineData(int count) {
  List<dynamic> data = [];
  Random random = Random();
  double open = 100.0;
  double close, high, low;
  num volume;

  for (int i = 0; i < count; i++) {
    close = open + random.nextDouble() * 20 - 10;
    high = max(open, close) + random.nextDouble() * 5;
    low = min(open, close) - random.nextDouble() * 5;
    volume = random.nextInt(10000) + 1000;

    data.add({
      'open': open,
      'close': close,
      'high': high,
      'low': low,
      'vol': volume,
    });

    open = close;
  }

  return data;
}
之后直接引用:
SliverToBoxAdapter(
  child: SizedBox(
    height: 300.w,
    child: KLineChart(data: generateKLineData(100)),
  ),
)
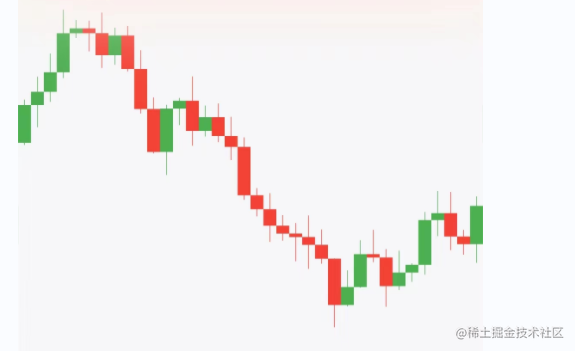
运行后如下效果:
可左右滑动,可伸缩,仅包含基本功能,真正的需要分时图,各种的指标,甚至是自定义的指标绘制等等,你可以根据需求进一步完善和优化。
技术人日拱一卒,共勉!

为开发者提供学习成长、分享交流、生态实践、资源工具等服务,帮助开发者快速成长。
更多推荐


 0
0 0
0- 0


 已为社区贡献9条内容

所有评论(0)