
【计算机视觉】CLIP实战:Zero-Shot Prediction(含源代码)
【计算机视觉】CLIP实战:Zero-Shot Prediction(含源代码)
一、代码实战
下面的代码使用 CLIP 执行零样本预测。 此示例从 CIFAR-100 数据集中获取图像,并预测数据集中 100 个文本标签中最可能的标签。
import os
import clip
import torch
from torchvision.datasets import CIFAR100
# Load the model
device = "cuda" if torch.cuda.is_available() else "cpu"
model, preprocess = clip.load('ViT-B/32', device)
# Download the dataset
cifar100 = CIFAR100(root=os.path.expanduser("./data/"), download=True, train=False)
# Prepare the inputs
image, class_id = cifar100[3637]
image_input = preprocess(image).unsqueeze(0).to(device)
text_inputs = torch.cat([clip.tokenize(f"a photo of a {c}") for c in cifar100.classes]).to(device)
# Calculate features
with torch.no_grad():
image_features = model.encode_image(image_input)
text_features = model.encode_text(text_inputs)
# Pick the top 5 most similar labels for the image
image_features /= image_features.norm(dim=-1, keepdim=True)
text_features /= text_features.norm(dim=-1, keepdim=True)
similarity = (100.0 * image_features @ text_features.T).softmax(dim=-1)
values, indices = similarity[0].topk(5)
# Print the result
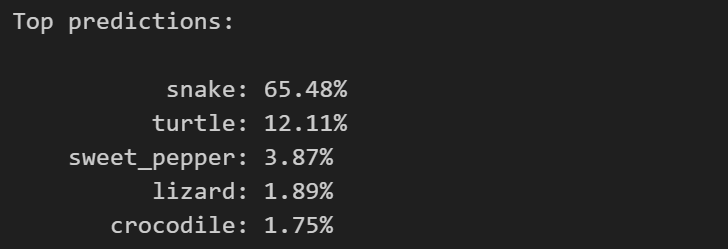
print("\nTop predictions:\n")
for value, index in zip(values, indices):
print(f"{cifar100.classes[index]:>16s}: {100 * value.item():.2f}%")
最后的输出结果为:
我们不妨可视化一下这张图片:
import os
import pickle
from PIL import Image
import matplotlib.pyplot as plt

# Define the path to the CIFAR-100 dataset
dataset_path = os.path.expanduser('./data/cifar-100-python')

# Load the image
with open(os.path.join(dataset_path, 'test'), 'rb') as f:
    cifar100 = pickle.load(f, encoding='latin1')

# Select an image index to visualize
image_index = 3637

# Extract the image and its label
image = cifar100['data'][image_index]
label = cifar100['fine_labels'][image_index]

# Reshape and transpose the image to the correct format
image = image.reshape((3, 32, 32)).transpose((1, 2, 0))

# Create a PIL image from the numpy array
pil_image = Image.fromarray(image)

# Display the image
plt.imshow(pil_image, interpolation='bilinear')
plt.title('Label: ' + str(label))
plt.axis('off')
plt.show()
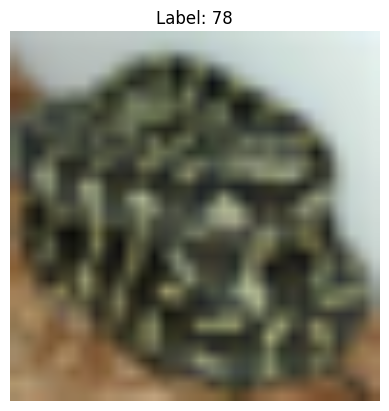
可以看到,很模糊的图片,这可能是因为 CIFAR-100 数据集本身就具有较低的图像分辨率,这是无法改变的。
二、代码逐行解读
2.1 预测
import os
import clip
import torch
from torchvision.datasets import CIFAR100
首先导入所需的库和模块,包括os、clip、torch和CIFAR100。
# Load the model
device = "cuda" if torch.cuda.is_available() else "cpu"
model, preprocess = clip.load('ViT-B/32', device)
确定设备类型(使用GPU还是CPU),并加载预训练的 CLIP 模型(Vision Transformer - B/32)。clip.load()函数会返回加载的模型和数据预处理函数。
# Download the dataset
cifar100 = CIFAR100(root=os.path.expanduser("./data/"), download=True, train=False)
下载 CIFAR-100 数据集,并将其保存到指定的根目录中(“./data/”)。CIFAR100类从 torchvision.datasets 模块中导入,用于加载 CIFAR-100 数据集。
# Prepare the inputs
image, class_id = cifar100[3637]
image_input = preprocess(image).unsqueeze(0).to(device)
text_inputs = torch.cat([clip.tokenize(f"a photo of a {c}") for c in cifar100.classes]).to(device)
准备输入数据。首先,从 CIFAR-100 数据集中获取指定索引(3637)的图像和类别 ID。然后,对图像进行预处理,包括规范化和转换为模型所需的张量格式,并将其移动到设备上(GPU或CPU)。接下来,生成文本输入,其中包括 CIFAR-100 数据集中所有类别的文本描述,也转换为模型所需的张量格式,并移动到设备上。
# Calculate features
with torch.no_grad():
    image_features = model.encode_image(image_input)
    text_features = model.encode_text(text_inputs)
计算图像和文本的特征向量。通过调用模型的encode_image()和encode_text()方法,将输入图像和文本转换为特征向量。由于不需要进行梯度计算,使用torch.no_grad()上下文管理器来禁止梯度计算。
# Pick the top 5 most similar labels for the image
image_features /= image_features.norm(dim=-1, keepdim=True)
text_features /= text_features.norm(dim=-1, keepdim=True)
similarity = (100.0 * image_features @ text_features.T).softmax(dim=-1)
values, indices = similarity[0].topk(5)
选择图像最相似的前 5 个标签。首先,对图像特征向量和文本特征向量进行归一化。然后,计算图像特征向量与所有文本特征向量之间的相似度。通过执行矩阵乘法和 softmax 操作,得到每个文本描述与图像的相似度。最后,从相似度中选择最高的前 5 个值和对应的索引。
# Print the result
print("\nTop predictions:\n")
for value, index in zip(values, indices):
    print(f"{cifar100.classes[index]:>16s}: {100 * value.item():.2f}%")
打印结果。将最相似的前 5 个标签及其对应的相似度打印出来,格式为类别名和百分比表示的相似度。
这段代码使用 CLIP 模型将图像与文本进行编码,并找到与图像最相似的文本标签。这可以用于图像分类或图像检索等任务。
2.2 可视化
import os
import pickle
from PIL import Image
import matplotlib.pyplot as plt
首先导入所需的库和模块,包括os、pickle、Image和matplotlib.pyplot。
# Define the path to the CIFAR-100 dataset
dataset_path = os.path.expanduser('./data/cifar-100-python')
定义 CIFAR-100 数据集的路径。os.path.expanduser()函数用于扩展用户目录中的路径。
# Load the image
with open(os.path.join(dataset_path, 'test'), 'rb') as f:
    cifar100 = pickle.load(f, encoding='latin1')
加载图像数据。使用open()函数打开 CIFAR-100 数据集中的图像文件(‘test’),并使用pickle.load()函数将图像数据加载到cifar100变量中。'latin1’是编码参数,用于指定加载数据的编码格式。
# Select an image index to visualize
image_index = 3637
选择一个图像的索引,用于可视化该图像。在这里,选择索引为 3637 的图像进行可视化。
# Extract the image and its label
image = cifar100['data'][image_index]
label = cifar100['fine_labels'][image_index]
提取所选图像和其标签。从cifar100字典中的’data’键中提取指定索引的图像数据,并从’fine_labels’键中提取相应的标签。
# Reshape and transpose the image to the correct format
image = image.reshape((3, 32, 32)).transpose((1, 2, 0))
调整图像的形状和排列顺序,使其与正确的格式匹配。reshape()函数将图像的形状从扁平的一维数组调整为(3, 32, 32)的三维数组,表示通道数、高度和宽度。然后,transpose()函数将维度重新排列,以将通道维度移至最后,得到(32, 32, 3)的图像格式。
# Create a PIL image from the numpy array
pil_image = Image.fromarray(image)
将 NumPy 数组转换为 PIL 图像对象。使用Image.fromarray()函数将 NumPy 数组image转换为 PIL 图像对象pil_image。
# Display the image
plt.imshow(pil_image, interpolation='bilinear')
plt.title('Label: ' + str(label))
plt.axis('off')
plt.show()
显示图像。使用plt.imshow()函数显示图像,通过设置interpolation参数为’bilinear’进行双线性插值,以改善图像的显示效果。plt.title()函数用于设置图像标题,标题中包含图像的标签。plt.axis(‘off’)用于关闭坐标轴的显示。最后,使用plt.show()函数显示图像。
这段代码加载 CIFAR-100 数据集中的图像数据,并可视化指定索引的图像及其标签。注意,通过使用双线性插值等图像显示选项,可以提高图像的清晰度和质量。

旨在为数千万中国开发者提供一个无缝且高效的云端环境,以支持学习、使用和贡献开源项目。
更多推荐


 3
3 0
0- 0


 已为社区贡献90条内容

所有评论(0)