

GDB调试工具
3、当程序被停住时,可以检查此时你的程序中所发生的事。4、你可以改变你的程序,将一个BUG产生的影响修正从而测试其他BUG。1、启动你的程序,可以按照你的自定义的要求随心所欲的运行程序(按着自己的想法运行)。GDB是GNU开源组织发布的一个强大的Linux下的程序调试工具。2、可让被调试的程序在你所指定的调置的断点处停住。edit [file:]function查看停止的信息。step如果有函数,
一、GDB简介
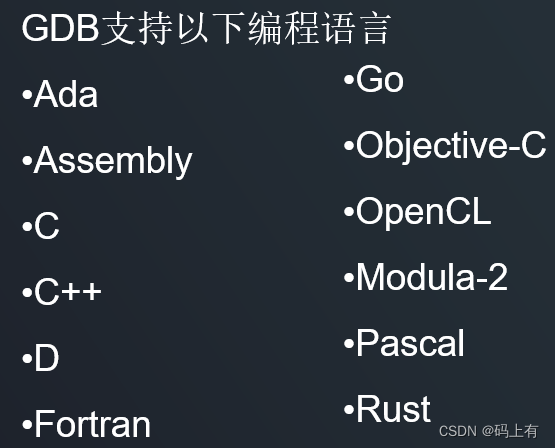
GDB是GNU开源组织发布的一个强大的Linux下的程序调试工具。
一般来说,GDB主要帮助你完成下面四个方面的功能:
1、启动你的程序,可以按照你的自定义的要求随心所欲的运行程序(按着自己的想法运行)。
2、可让被调试的程序在你所指定的调置的断点处停住。(断点可以是条件表达式)
3、当程序被停住时,可以检查此时你的程序中所发生的事。4、你可以改变你的程序,将一个BUG产生的影响修正从而测试其他BUG。
二、GDB基本命令
Here are some of the most frequently needed GDB commands:
break [file:]function 设置断点(简写b)
Set a breakpoint at function (in file).
run [arglist]程序运行起来
Start your program (with arglist, if specified).
bt Backtrace: display the program stack.查看栈
print expr 打印输出
Display the value of an expression.
c Continue running your program (after stopping, e.g. at abreakpoint).全部执行完
next一步一步运行
Execute next program line (after stopping); step over any function
calls in the line.
edit [file:]function查看停止的信息
look at the program line where it is presently stopped.
list [file:]function查看代码信息
type the text of the program in the vicinity of where it is
presently stopped.
step如果有函数,进入函数,查看函数里面的信息
Execute next program line (after stopping); step into any function
calls in the line.
help [name]
Show information about GDB command name, or general information
about using GDB.
quit
Exit from GDB.
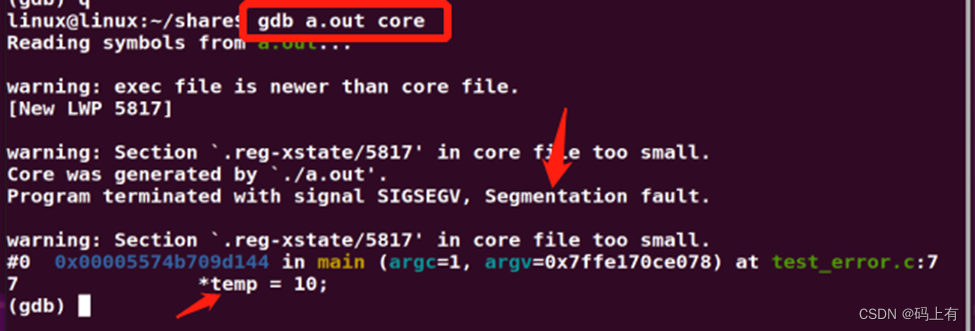
三、GDB调试core文件
You can also start with both an executable program and a core file specified:
gdb program core
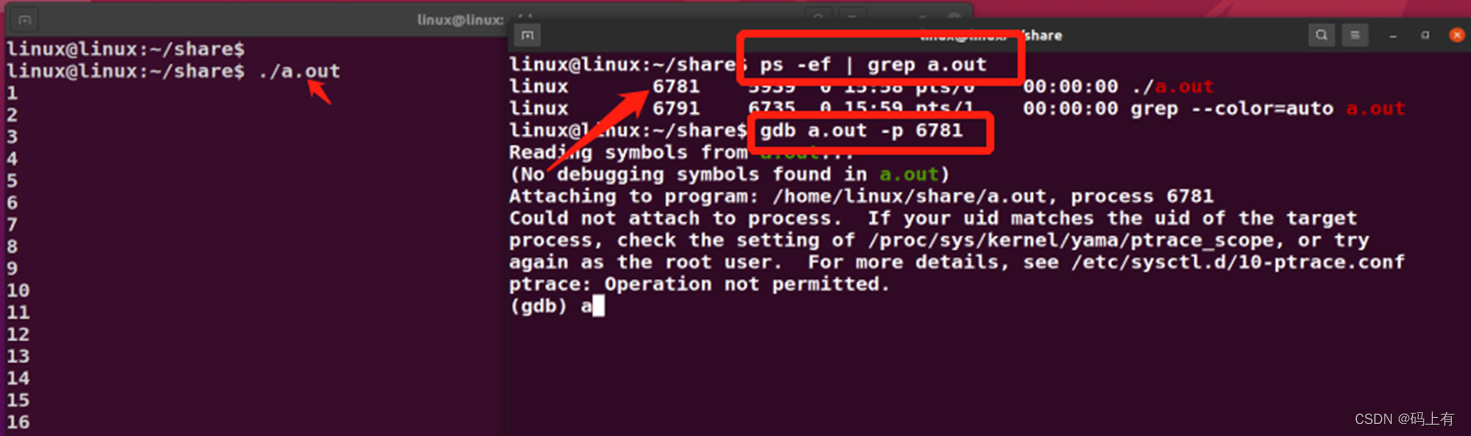
GDB调试正在运行的进程
You can, instead, specify a process ID as a second argument or use option "-p", if you want to debug a running process:
gdb program 1234
gdb -p 1234

旨在为数千万中国开发者提供一个无缝且高效的云端环境,以支持学习、使用和贡献开源项目。
更多推荐


 0
0 0
0- 0


 已为社区贡献2条内容

所有评论(0)