
BCC Python开发教程&常用BCC工具(三)
这个教程主要目的是展示如何使用python来进行bcc工具开发和编程。教程主要分为两个部分:可观察性和网络。文中的代码片段均都来自于bcc:代码片段的licenses见bcc中具体文件。也可参考bcc开发者手册以及end-users工具教程:。此外bcc还开放有lua接口。
·
Lesson 9. bitehist.py
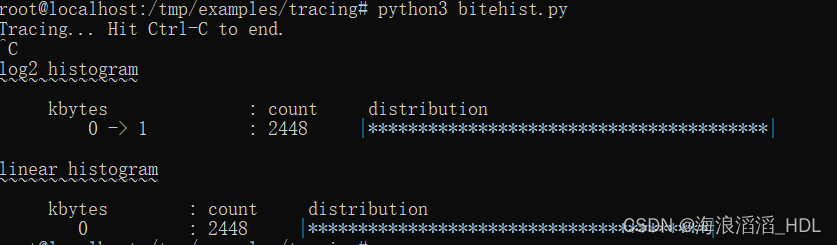
下面这个工具以直方图方式记录disk I/O大小,示例输出如下:
代码如下:
#!/usr/bin/python
#
# bitehist.py Block I/O size histogram.
# For Linux, uses BCC, eBPF. Embedded C.
#
# Written as a basic example of using histograms to show a distribution.
#
# A Ctrl-C will print the gathered histogram then exit.
#
# Copyright (c) 2015 Brendan Gregg.
# Licensed under the Apache License, Version 2.0 (the "License")
#
# 15-Aug-2015 Brendan Gregg Created this.
# 03-Feb-2019 Xiaozhou Liu added linear histogram.

from __future__ import print_function
from bcc import BPF
from time import sleep

# load BPF program
b = BPF(text="""
#include <uapi/linux/ptrace.h>
#include <linux/blk-mq.h>

BPF_HISTOGRAM(dist);
BPF_HISTOGRAM(dist_linear);

int trace_req_done(struct pt_regs *ctx, struct request *req)
{
dist.increment(bpf_log2l(req->__data_len / 1024));
dist_linear.increment(req->__data_len / 1024);
return 0;
}
""")

if BPF.get_kprobe_functions(b'__blk_account_io_done'):
b.attach_kprobe(event="__blk_account_io_done", fn_name="trace_req_done")
else:
b.attach_kprobe(event="blk_account_io_done", fn_name="trace_req_done")

# header
print("Tracing... Hit Ctrl-C to end.")

# trace until Ctrl-C
try:
sleep(99999999)
except KeyboardInterrupt:
print()

# output
print("log2 histogram")
print("~~~~~~~~~~~~~~")
b["dist"].print_log2_hist("kbytes")

print("\nlinear histogram")
print("~~~~~~~~~~~~~~~~")
b["dist_linear"].print_linear_hist("kbytes")
让我们回顾一下前面的课程:
- kprobe__:以这个为前缀开表达式中后面的字符串表示要安装kprobe钩子的内核函数。
- struct pt_regs *ctx, struct request *req:kprobe钩子函数的参数。参数ctx存着寄存器和BPF的上下文;参数req是被跟踪内核函数(这里是blk_account_io_done())第一个参数。
- req->__data_len: 对参数成员进行引用。
需要学习的新东西:
- BPF_HISTOGRAM(dist): 定义一个histogram类型BPF map 对象,其名字为"dist"。
- dist.increment(): 增加dist标记索引,第一个参数表示增加的步长,如果没有指定参数,默认步长为1。或者也可以自己将第二个参数作为步长。
- bpf_log2l(): 对参数进行log-2计算,其结果作为直方图索引,这样我们可以构建一个2阶直方图。
- b["dist"].print_log2_hist("kbytes"): 打印"dist"的2阶直方图, 以kbytes作为输出列的头信息。由于 bucket计数是内核到用户态传输的唯一数据,因此这种方式效率很高。
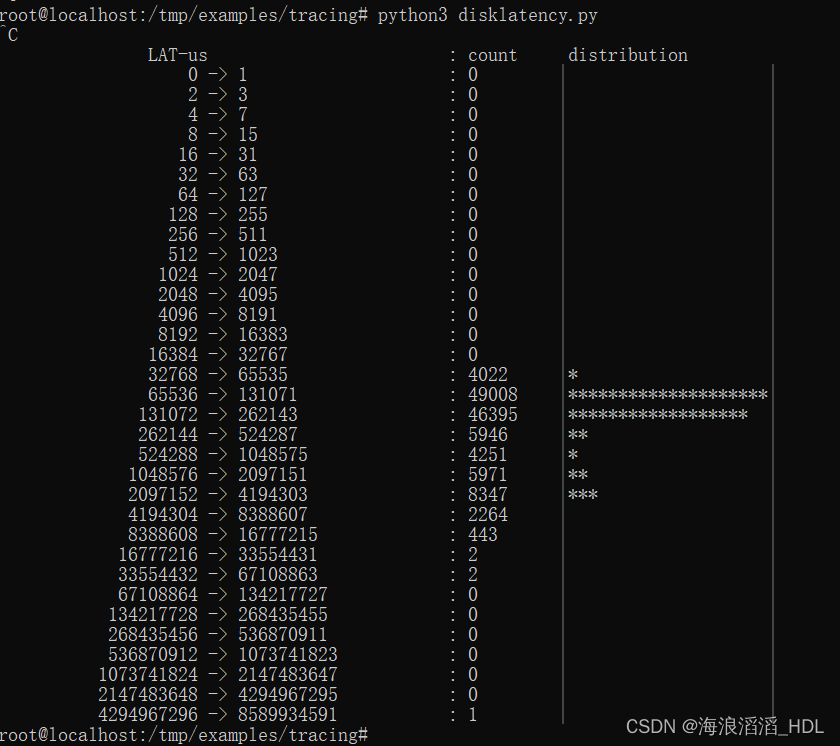
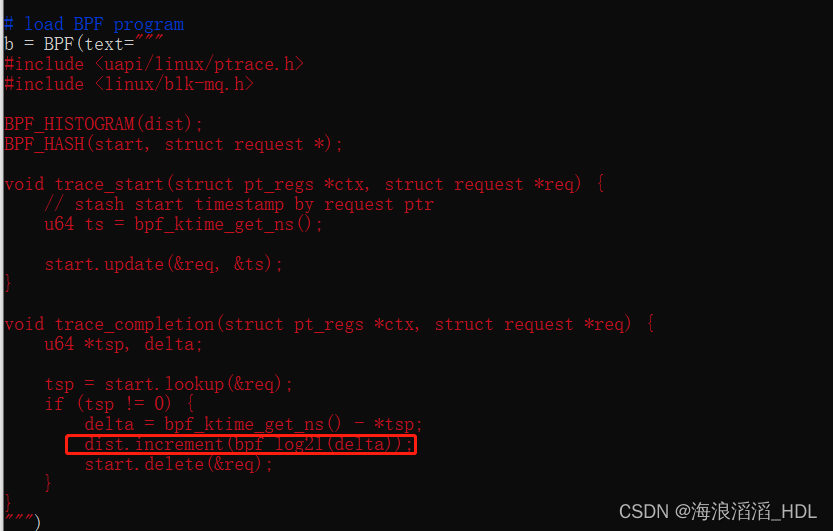
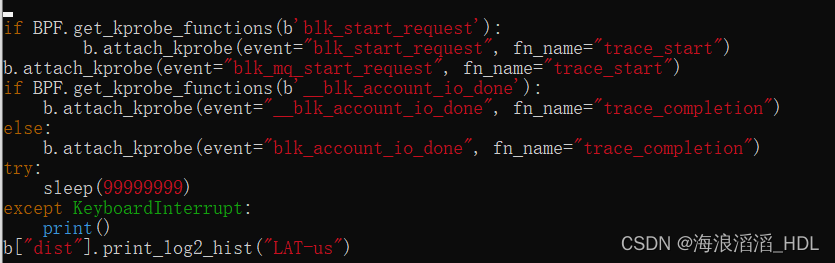
Lesson 10. disklatency.py
编写一个程序记录disk I/O的时间,并打印出这些延迟时间的直方图。Disk I/O 的监测和计时可参考上一节的disksnoop.py程序,直方图代码可以参考上一节的bitehist.py程序。
修改如下:
Lesson 11. vfsreadlat.py
这个例子程序拆分为单独的Python 和 C 文件。输出如下:

代码如下:
/*
* vfsreadlat.c VFS read latency distribution.
* For Linux, uses BCC, eBPF. See .py file.
*
* Copyright (c) 2013-2015 PLUMgrid, http://plumgrid.com
* This program is free software; you can redistribute it and/or
* modify it under the terms of version 2 of the GNU General Public
* License as published by the Free Software Foundation.
*
* 15-Aug-2015 Brendan Gregg Created this.
*/
#include <uapi/linux/ptrace.h>
BPF_HASH(start, u32);
BPF_HISTOGRAM(dist);
int do_entry(struct pt_regs *ctx)
{
u32 pid;
u64 ts, *val;
pid = bpf_get_current_pid_tgid();
ts = bpf_ktime_get_ns();
start.update(&pid, &ts);
return 0;
}
int do_return(struct pt_regs *ctx)
{
u32 pid;
u64 *tsp, delta;
pid = bpf_get_current_pid_tgid();
tsp = start.lookup(&pid);
if (tsp != 0) {
delta = bpf_ktime_get_ns() - *tsp;
dist.increment(bpf_log2l(delta / 1000));
start.delete(&pid);
}
return 0;
}
#!/usr/bin/python
#
# vfsreadlat.py VFS read latency distribution.
# For Linux, uses BCC, eBPF. See .c file.
#
# Written as a basic example of a function latency distribution histogram.
#
# USAGE: vfsreadlat.py [interval [count]]
#
# The default interval is 5 seconds. A Ctrl-C will print the partially
# gathered histogram then exit.
#
# Copyright (c) 2015 Brendan Gregg.
# Licensed under the Apache License, Version 2.0 (the "License")
#
# 15-Aug-2015 Brendan Gregg Created this.

from __future__ import print_function
from bcc import BPF
from time import sleep
from sys import argv

def usage():
print("USAGE: %s [interval [count]]" % argv[0])
exit()

# arguments
interval = 5
count = -1
if len(argv) > 1:
try:
interval = int(argv[1])
if interval == 0:
raise
if len(argv) > 2:
count = int(argv[2])
except: # also catches -h, --help
usage()

# load BPF program
b = BPF(src_file = "vfsreadlat.c")
b.attach_kprobe(event="vfs_read", fn_name="do_entry")
b.attach_kretprobe(event="vfs_read", fn_name="do_return")

# header
print("Tracing... Hit Ctrl-C to end.")

# output
loop = 0
do_exit = 0
while (1):
if count > 0:
loop += 1
if loop > count:
exit()
try:
sleep(interval)
except KeyboardInterrupt:
pass; do_exit = 1

print()
b["dist"].print_log2_hist("usecs")
b["dist"].clear()
if do_exit:
exit()
需要学习的东西:
- b = BPF(src_file = "vfsreadlat.c"): 从一个单独的C语言文件读取程序。
- b.attach_kretprobe(event="vfs_read", fn_name="do_return"): 将BPF C函数do_return() 添加到内核函数 vfs_read()的返回点kprobe钩子中,也就是kretprobe:跟踪的是一个内核函数的返回点,而非进入点。
- b["dist"].clear(): 清除histogram.
Lesson 12. urandomread.py
跟踪dd if=/dev/urandom of=/dev/null bs=8k count=5命令:
代码如下:
#!/usr/bin/python
#
# urandomread Example of instrumenting a kernel tracepoint.
# For Linux, uses BCC, BPF. Embedded C.
#
# REQUIRES: Linux 4.7+ (BPF_PROG_TYPE_TRACEPOINT support).
#
# Test by running this, then in another shell, run:
# dd if=/dev/urandom of=/dev/null bs=1k count=5
#
# Copyright 2016 Netflix, Inc.
# Licensed under the Apache License, Version 2.0 (the "License")

from __future__ import print_function
from bcc import BPF
from bcc.utils import printb

# load BPF program
b = BPF(text="""
TRACEPOINT_PROBE(random, urandom_read) {
// args is from /sys/kernel/debug/tracing/events/random/urandom_read/format
bpf_trace_printk("%d\\n", args->got_bits);
return 0;
}
""")

# header
print("%-18s %-16s %-6s %s" % ("TIME(s)", "COMM", "PID", "GOTBITS"))

# format output
while 1:
try:
(task, pid, cpu, flags, ts, msg) = b.trace_fields()
except ValueError:
continue
except KeyboardInterrupt:
exit()
printb(b"%-18.9f %-16s %-6d %s" % (ts, task, pid, msg))- TRACEPOINT_PROBE(random, urandom_read): 跟踪内核tracepoint函数random:urandom_read。由于tracepoint的API比较稳定,一般不会轻易修改;因而相较于kprobe,只要能够使用tracepoint就尽量选择tracepoint跟踪。可以通过perf list命令来列出有哪些可用的tracepoints。在Linux >= 4.7 的版本中要求将BPF 程序 attach 到tracepoints。
- args->got_bits: args 是自动生成的,其类型为tracepoint参数类型数据结构。上面代码中的注释提示可以在哪里查找到这个结构体。
Lesson 13. disksnoop.py fixed版
对前一节的disksnoop.py程序进行修改,这次跟踪block:block_rq_issue 和 block:block_rq_complete 两个tracepoints点。

瓜分20万奖金 获得内推名额 丰厚实物奖励 易参与易上手
更多推荐
 0
0 0
0- 0


 已为社区贡献1条内容

所有评论(0)