Vue2+Js项目引入echarts详解
vue2项目引入echarts详解,十分钟速通echarts引入及使用
·
文章目录
一、安装 Echarts
npm install echarts --save
二、在 main.js 中全局引入 Echarts
// 引入 echarts
import * as echarts from 'echarts'
Vue.prototype.$echarts = echarts
三、在vue文件中使用
(注:挂载 echarts 图的父级盒子必须有宽高)
效果图:

全量代码
<template>
  <div class="home">
    <!-- 这个 div 就会被解析为 echarts图 -->
    <div class="barChart" ref="barChart"></div>
  </div>
</template>

<script>
export default {
  mounted() {
    // 初始化 echarts
    this.initBarChart();
  },
  methods: {
    initBarChart() {
      // 通过 $ref 进行挂载
      let myChart = this.$echarts.init(this.$refs.barChart);
      let option = {
        xAxis: {
          type: "category",
          data: ["Mon", "Tue", "Wed", "Thu", "Fri", "Sat", "Sun"],
        },
        yAxis: {
          type: "value",
        },
        series: [
          {
            data: [120, 200, 150, 80, 70, 110, 130],
            type: "bar",
            showBackground: true,
            backgroundStyle: {
              color: "rgba(180, 180, 180, 0.2)",
            },
          },
        ],
      };
      myChart.setOption(option);
    },
  },
};
</script>
<style scoped lang="less">
.home {
  width: 500px;
  height: 400px;
  margin: auto;
  border: 3px solid lightcoral;

  //  宽高是必须给的,可以给百分比、具体的像素等....
  .barChart {
    width: 100%;
    height: 100%;
  }
}
</style>
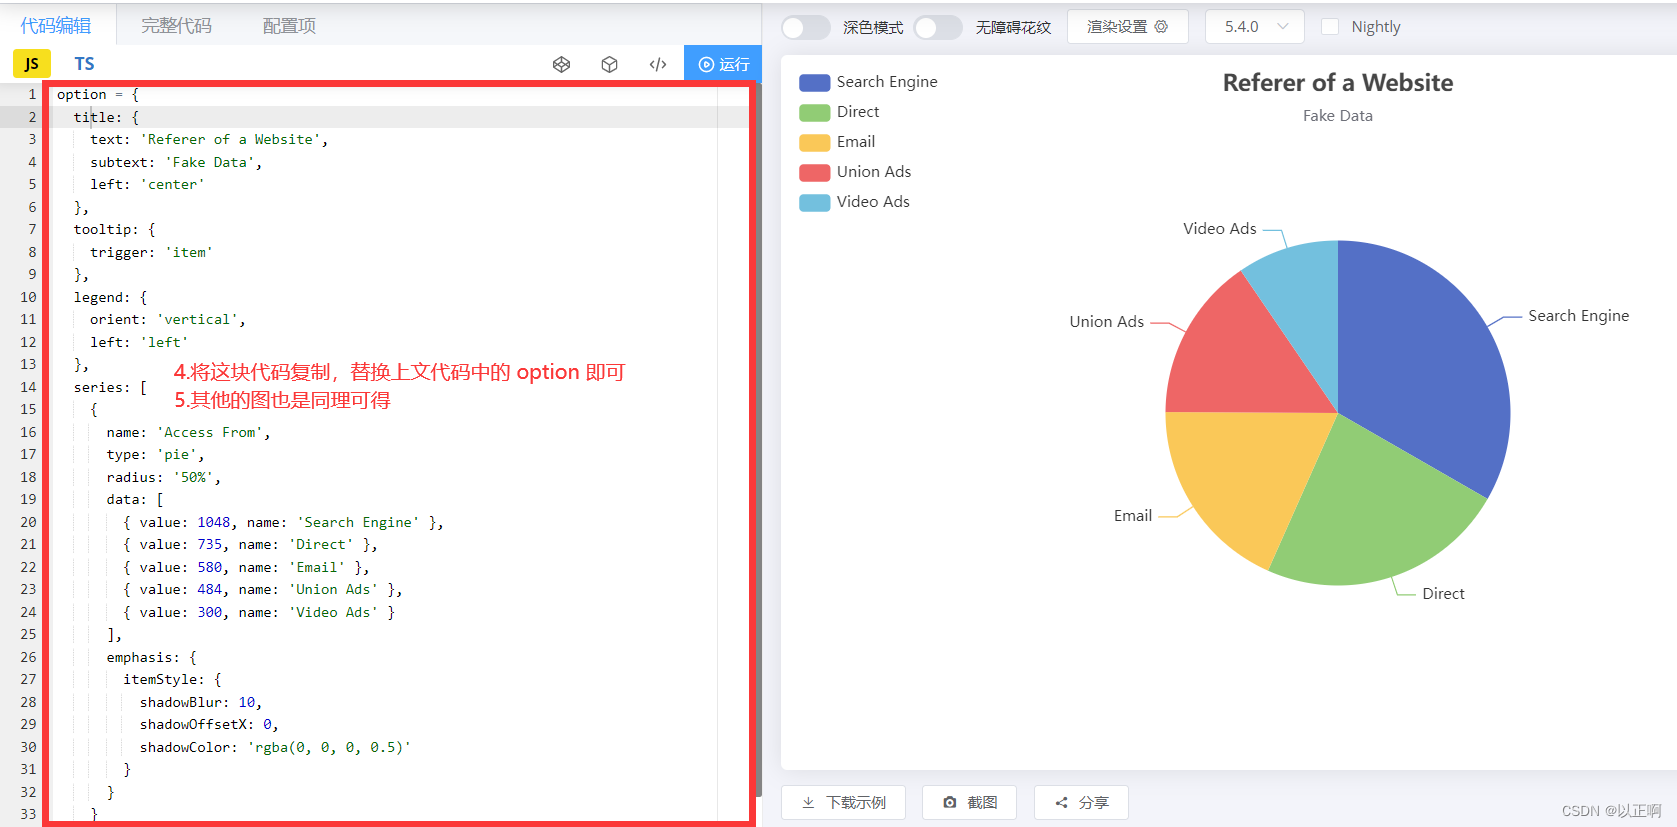
四:如何使用其他图例
一、点击进入echarts官网
二、进行如下操作即可


更多推荐
 已为社区贡献12条内容


所有评论(0)