uni-app map路线轨迹回放功能及turf.js实现缓冲区渲染(微信小程序)
uni-app map路线轨迹回放功能
·
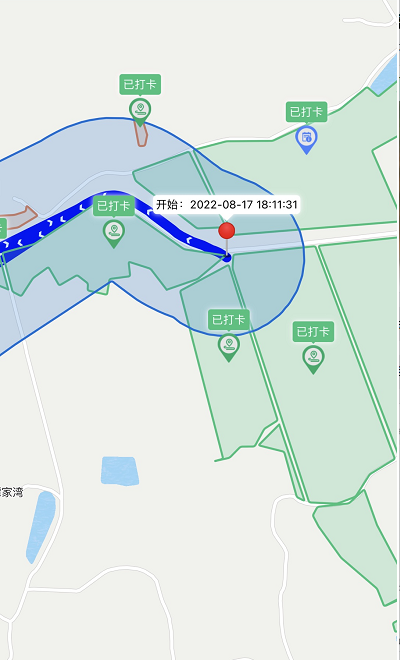
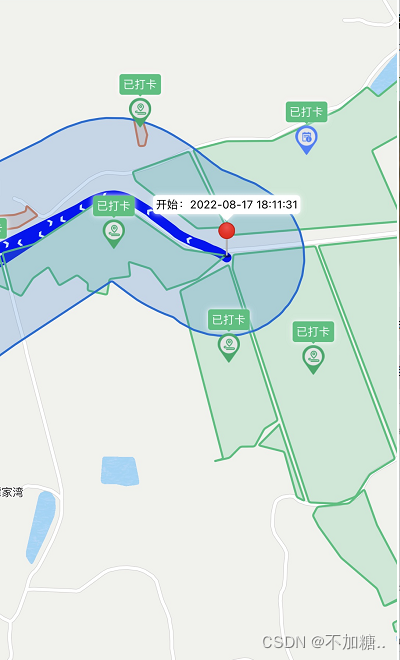
使用uni-app中 map组件实现路线轨迹回放功能。
1、通过接口获取返回的轨迹点。
2、地图的坐标系与轨迹点的坐标系要保持一致,否则轨迹有偏差。点经纬度转换,wgs84togcj02 =》js工具类合集(utils.js)
3、绘制开始结束点,设置地图经纬度。
4、polyline,绘制路线点,属性:[{
points: arr,//经纬度数组
color: '#0000FF',//线的颜色
width: 10,//线的宽度
borderWidth: 2, //线的厚度
arrowLine: true, //带箭头的线
//colorList:[],//彩虹线
//borderColor:'',//线的边框颜色
//arrowIconPath:'',//更换箭头图标,在arrowLine为true时生效
//dottedLine:'',//是否虚线,默认false
}]
5、include-points:自动缩放展示全部轨迹。
6、触发实时轨迹方法movePoint()。
属性可参考:uniapp - Map地图组件属性示例
GET START | Turf.js中文网 (fenxianglu.cn)
代码示例:
<!-- 路线轨迹回放 -->
<template>
	<view class="wrap">
		<map
			id="map"
			style="height: 100vh; width:100%;"
			:latitude="map.latitude"
			:longitude="map.longitude"
			:include-points="polygons[0].points"
			:polyline="polyline"
			:show-location="true"
			:polygons="polygons"
			:markers="markers"
		>
		</map>

	</view>
</template>

<script>
import { wgs84togcj02} from '@/utils/utils';
import { lineString } from '@turf/helpers';
import  buffer  from '@turf/buffer';
export default {
	name: '',
	data() {
		return {
			nextPointIndex: 1,
			map: {//地图对象
				latitude: '',
				longitude: '',
			},
			polyline: [{
				points: [],
				color: '#0000FF',
				width: 10,
				borderWidth: 2
			}],
			polygons:[],
			markers:[],
		}
	},
	created() {

	},
	onLoad() {

	},
	onShow() {
        this.getTrack();
	},
	methods: {
		//获取轨迹记录
		getTrack(){
			const that = this;
			let geometry=[
                {"time":"2022-08-14 22:55:37","Ing":112.98802691401623,"lat":28.05910306601405},
				{"time":"2022-08-14 22:55:41", "Ing":112.98801582826378,"lat":28.059165228204222},
				{"time":"2022-08-14 22:55:41", "Ing":112.98801096604619,"lat":28.05913404298643},
				{"time":"2022-08-14 22:55:47", "Ing":112.98798123606018,"lat":28.05914796956938}
			]
			let arr = [];
            let arr2 = [];
			that.map.latitude = wgs84togcj02(geometry[0].lng, geometry[0].lat)[1];
			that.map.longitude = wgs84togcj02(geometry[0].lng, geometry[0].lat)[0];
				that.markers.push({
					id: 0,
					latitude: that.map.latitude,
					longitude: that.map.longitude,
					width:24,
					height:32,
					// iconPath: require('../../static/images/touxiang.png'),
					callout:{
						content: '开始:'+e.createdTime,//文本
						color:"#000000",
						fontSize:12,
						borderRadius:4,
						bgColor:"#ffffff",
						padding:2,
						display:"ALWAYS",
						textAlign:"center",
					}
				})

			JSON.parse(JSON.stringify(geometry)).forEach((item,index) => {
				let obj = {};
				obj['latitude'] = wgs84togcj02(item.lng, item.lat)[1];
				obj['longitude'] = wgs84togcj02(item.lng, item.lat)[0];
				arr.push(obj);
				arr2.push([item.lng,item.lat]);
				if(index==geometry.length-1 && e.updatedTime){
					that.markers.push({
						id: 1,
						latitude: obj.latitude,
						longitude: obj.longitude,
						width:24,
						height:32,
						// iconPath: require('../../static/images/touxiang.png'),
						callout:{
							content: '结束:'+e.updatedTime,//文本
							color:"#000000",
							fontSize:12,
							borderRadius:4,
							bgColor:"#FFFFFF",
							padding:2,
							display:"ALWAYS",
							textAlign:"center",
						}
					})
				}
			});
			that.polyline = [{
				points: arr,//经纬度数组
				color: '#0000FF',//线的颜色
				width: 10,//线的宽度
				borderWidth: 2, //线的厚度
				arrowLine: true, //带箭头的线
                //colorList:[],//彩虹线
                //borderColor:'',//线的边框颜色
                //arrowIconPath:'',//更换箭头图标,在arrowLine为true时生效
                //dottedLine:'',//是否虚线,默认false
			}];

            //绘制缓冲区
			if(arr2.length <1) return;
			var linestrings = lineString(arr2);
			console.log("linestrings",linestrings)
			// 默认单位是千米,与下面的写法一致
			var buffereds = buffer(linestrings, 100, {units: 'meters'});
			var polygonlist = buffereds.geometry.coordinates[0];
			var mapPolygon=[];
			JSON.parse(JSON.stringify(polygonlist)).map((item)=>{
				// 绘制路线点
				mapPolygon.push({
					latitude: wgs84togcj02(item[0], item[1])[1],
					longitude: wgs84togcj02(item[0], item[1])[0]
				});
			})
			that.polygons = [{
				points: JSON.parse(JSON.stringify(mapPolygon)),
				strokeWidth:2,
				strokeColor:'#0070d9',
				fillColor:'#0070d933',
				zIndex:2
			}];

			//动态轨迹 方法一(微信小程序中无效果)
			// this.mapContext.moveAlong({
			// 	markerId: 1,
			// 	path: that.polyline[0].points,
			// 	duration: 5000,
			// 	autoRotate:true,
			// 	success(res) {
			// 		console.log('####:',res);
			// 	}
			// });

			//动态轨迹 方法二
			this.movePoint();
		},
		//实时轨迹
		movePoint(){
			let durationTime = Math.ceil(30000 / this.polyline[0].points.length)	//默认播放全程使用30秒,计算相连两点动画时长
			this.mapContext.translateMarker({
				duration: durationTime,
				markerId: 1,
				destination: {
					latitude: this.polyline[0].points[this.nextPointIndex].latitude,
					longitude: this.polyline[0].points[this.nextPointIndex].longitude
				},
				animationEnd: res => {
					//播放结束,继续移动到下一个点,最后一个点时结束移动
					if (this.nextPointIndex < this.polyline[0].points.length - 1) {
						this.nextPointIndex++
							this.movePoint()
					} else {
						this.nextPointIndex = 1

					}
				}
			})
		},
	}
}
</script>
为开发者提供学习成长、分享交流、生态实践、资源工具等服务,帮助开发者快速成长。
更多推荐


 1
1 0
0- 0


 已为社区贡献8条内容

所有评论(0)