在vue2项目中使用echarts
在vue项目中使用echarts
·
1、安装 echarts 依赖:echarts
npm install echarts -S
// 或者使用淘宝的镜像
npm install -g cnpm --registry=https:// registry.npm.taobao.org
cnpm install echarts -S
2.在main.js中全局引入echarts
import echarts from 'echarts';
Vue.prototype.$echarts = echarts;
3.在页面中使用
<template>
<div id="myChart" :style="{ width: '800px', height: '500px' }"></div>
</template>
<script>
export default {
name: "Pc2FbEcharts",
data() {
return {};
},
mounted() {
this.drawLine();
},
methods: {
drawLine() {
// 基于准备好的dom,初始化echarts实例
let myChart = this.$echarts.init(document.getElementById("myChart"));
// 绘制图表
myChart.setOption({
title: {
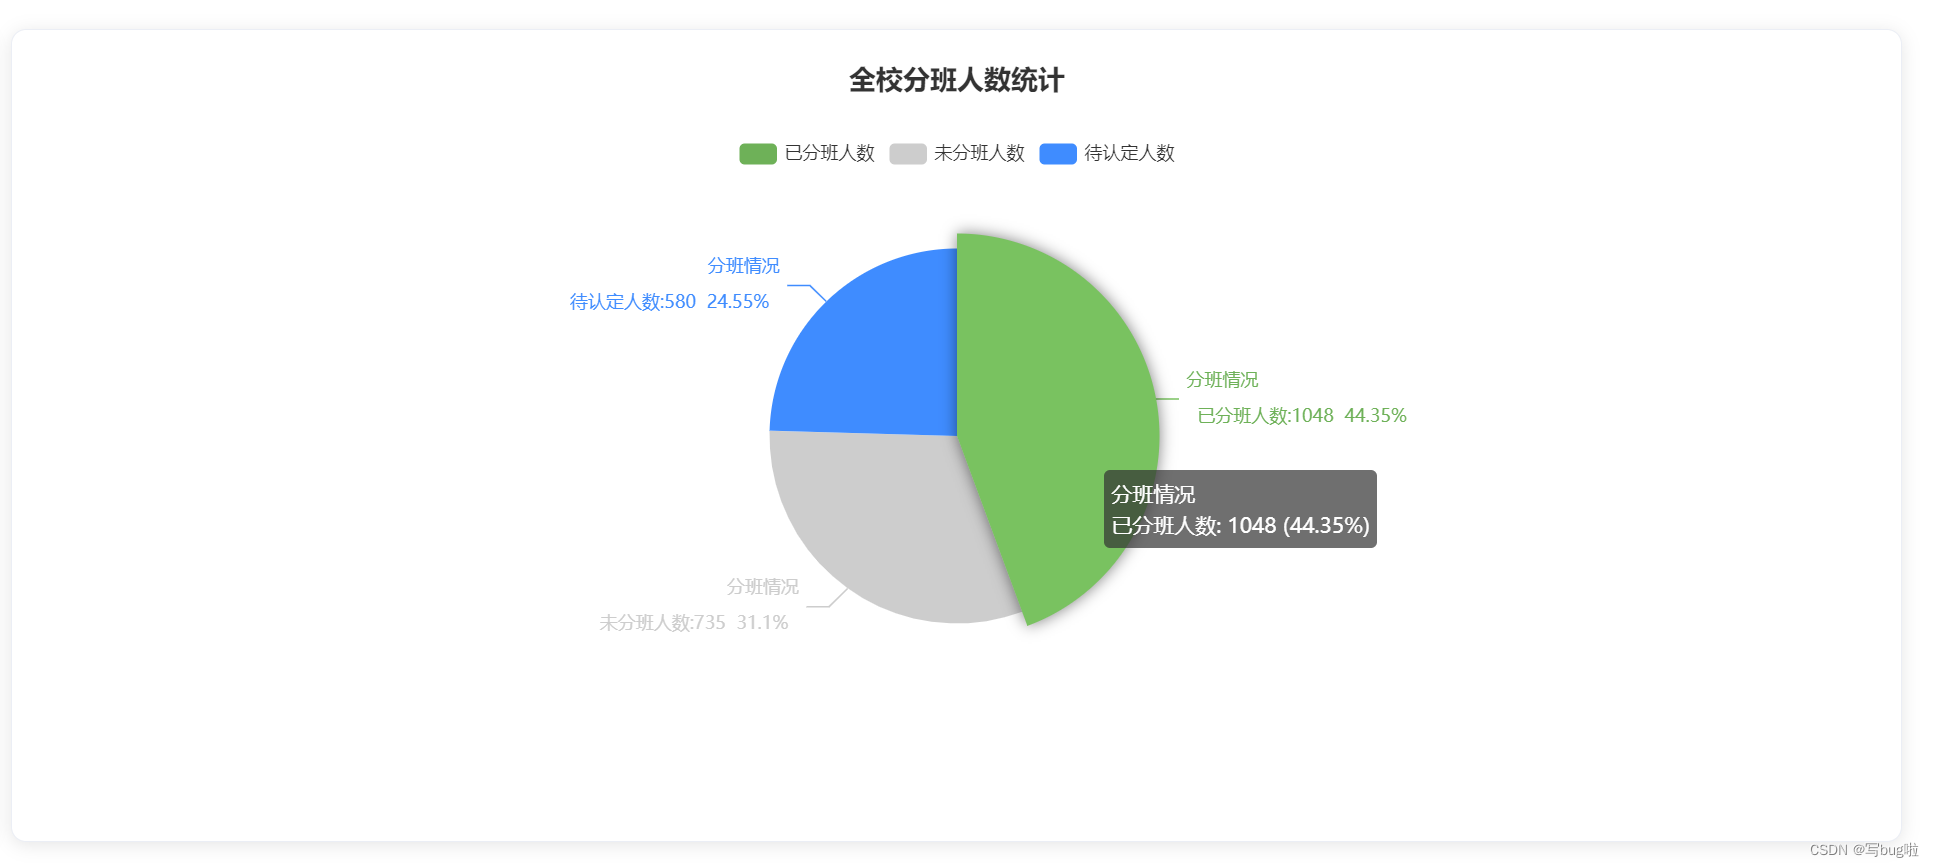
text: "全校分班人数统计",
left: "center",
},
tooltip: {
trigger: "item",
formatter: "{a} <br/>{b}: {c} ({d}%)",
},
legend: {
top: "10%",
left: "center",
},
color: ['#6eb158', '#cdcdcd', '#3f8cff'],
series: [
{
name: "分班情况",
type: "pie",
radius: "50%",
data: [
{ value: 1048, name: "已分班人数" },
{ value: 735, name: "未分班人数" },
{ value: 580, name: "待认定人数" },
],
emphasis: {
itemStyle: {
shadowBlur: 10,
shadowOffsetX: 0,
shadowColor: "rgba(0, 0, 0, 0.5)",
},
},
label: {
formatter: "{a|{a}}{abg|}\n{hr|}\n {b|{b}:}{c} {per|{d}%} ",
backgroundColor: "",
borderColor: "",
borderWidth: 1,
borderRadius: 4,
rich: {},
},
},
],
});
},
},
};
</script>5.效果图


前往低代码交流专区
更多推荐

 7
7 0
0- 0


 已为社区贡献1条内容

所有评论(0)