在 Vue 项目中使用 Open Layers
Open Layers 点、线、面以及聚合点功能整合
·
Open Layers 独立组件,在实际 Vue 项目中直接复制粘贴即可使用,并根据自身需求开启对应图案绘制方法,也可以设置点击按钮作为绘制方式切换,此次需求未设计不做开发。
因为是在 Vue 项目中创建的组件,所以需要引入 Vue-cli 以及 ol 组件,详细创建方式可见vue+openlayers : 从0 到1 搭建开发环境
如果只做测试,建议在 Vue-cli 项目的 App.vue 文件中直接引入,并注释自带的样式,避免样式出错,App.vue文件代码如下:
<template>
  <div id="app">
    <open-layers-map></open-layers-map>
  </div>
</template>

<script>
import OpenLayersMap from './views/OpenLayersMap.vue'
export default {
  components: { OpenLayersMap },
  name: 'App'
}
</script>

<style>
#app {
  /* font-family: 'Avenir', Helvetica, Arial, sans-serif;
  -webkit-font-smoothing: antialiased;
  -moz-osx-font-smoothing: grayscale;
  text-align: center;
  color: #2c3e50;
  margin-top: 60px; */
}
</style>
在 src 文件夹下创建 view 文件夹,同时创建 OpenLayersMap.vue 文件,详细代码如下:
<template>
  <div>
    <div id='map' style='width: 100%; height: 920px'></div>
  </div>
</template>

<script>
import 'ol/ol.css'
import {Map, View, Feature} from 'ol'
import OSM from 'ol/source/OSM'
import VectorSource from 'ol/source/Vector'
import Cluster from 'ol/source/Cluster'
import {Vector as VectorLayer, Tile as TileLayer} from 'ol/layer'
import {Style, Fill as StyleFill, Stroke as StyleStroke, Circle as StyleCircle, Text as StyleText} from 'ol/style'
import { Circle as GeomCircle, Point as GeomPoint, LineString as GeomLineString, Polygon as GeomPolygon } from 'ol/geom'
import { Draw as InteractionDraw } from 'ol/interaction'

export default {
  name: 'OpenLayersMap',
  data () {
    return {
      map: null,
      points: [],
      // 线条点数组
      linePoints: [],
      // 多边形数组
      polygonPoints: [],
    }
  },
  methods: {
    createMap () {
      let _this = this

      this.map = new Map({
        target: 'map',
        layers: [
          new TileLayer({
            source: new OSM({})
          }),
        ],
        view: new View({
          // 设置中心点,默认厦门,用于规划厦门市的未来发展
          center: [118.15075122802735, 24.482664909344276],
          projection: 'EPSG:4326',
          // 设置缩放倍数
          zoom: 13,
          minZoom: 6,
          maxZoom: 20
        })
      })
      // 绑定点击事件
      this.map.on('click', function (e) {
        let coor = e.coordinate
        // console.log(e.coordinate)
        // console.log('lon:' + coor[0] + ',lat:' + coor[1])
        _this.handleClick(coor)
      })
      // 绘制聚合点
      _this.addMarker()
    },
    // 设置统一控制点击事件,需要画图方式在此处切换
    handleClick(point) {
      // 绘制连线
      // this.drawLineString(point)
      // 绘制点
      // this.drawPoint(point)
      // 绘制圆形
      // this.drawCircle(point)
      // 绘制多边形
      // this.drawPolygon(point)
    },
    // 绘制点位
    drawPoint (center) {
      let vectorLayer = this.getLayer()

      let point = new GeomPoint(center)
      let feature = new Feature(point)
      vectorLayer.getSource().addFeature(feature)
      this.map.addLayer(vectorLayer)
    },
    // 绘制连线
    drawLineString(point) {
      this.linePoints.push(point)
      let featureLine = new Feature({
        geometry: new GeomLineString(this.linePoints),
      });
      let source = new VectorSource()
      source.addFeature(featureLine)
      let layer = new VectorLayer()
      layer.setSource(source)
      this.map.addLayer(layer)
    },
    // 绘制区域圆形
    drawCircle (center) {
      let vectorLayer = this.getLayer()

      // 设置半径
      let circle = new GeomCircle(center, 0.003)// 新建圆对象
      let feature = new Feature(circle)// 新建Feature对象 并将circle传入
      vectorLayer.getSource().addFeature(feature)// 将Feature对象填入图层源
      this.map.addLayer(vectorLayer) // 将图层添至地图对象
    },
    //画多边形
    drawPolygon(point){
      this.polygonPoints.push(point)
      let feature = new Feature({
        geometry: new GeomPolygon([this.polygonPoints]),
        attributes: null
      });
      // 添加线的样式
      let lineStyle = new Style({
        fill: new StyleFill({
          color: 'rgba(1, 210, 241, 0.1)'
        }),
        stroke: new StyleStroke({
          color: 'rgba(255, 0, 0)',
          width: 4,
        }),
      });
      feature.setStyle(lineStyle);
      let source = new VectorSource();
      source.addFeature(feature)
      let vectorLayer = new VectorLayer({
        source: source
      })
      this.map.addLayer(vectorLayer)
    },
    // 设置聚合点
    addMarker() {
      let source = new VectorSource();
      // 随机创建200个要素,后台点位取出后按此格式处理
      for (let i = 1; i <= 200; i++) {
        let coordinates = [118.10 + Math.random() * 0.05, 24.48 + Math.random() * 0.05];
        let feature = new Feature(new GeomPoint(coordinates));
        source.addFeature(feature);
      }

      // 聚合
      let clusterSource = new Cluster({
        source: source,
        distance: 50
      })

      let clusters = new VectorLayer({
        source: clusterSource,
        style: function (feature, resolution) {
          let size = feature.get('features').length;
          let style = new Style({
            image: new StyleCircle({
              radius: 20,
              stroke: new StyleStroke({
                color: 'white'
              }),
              fill: new StyleFill({
                color: '#AAD3DF'
              })
            }),
            text: new StyleText({
              text: size.toString(),
              fill: new StyleFill({
                color: 'black'
              })
            })
          })
          return style;
        }
      });

      this.map.addLayer(clusters)
    },
    // 获取新的 layer 图层对象
    getLayer () {
      return new VectorLayer({
        source: new VectorSource({
          features: ''
        }),
        // 设置样式,但不完全兼容
        // style: function (feature) {
        //   let style = new Style({
        //     stroke: new StyleStroke({
        //       color: '#E80000',
        //       width: 2
        //     }),
        //     fill: new StyleFill({
        //       color: 'rgba(0,0,0,0)'
        //     })
        //   })
        //   return style
        // }
      })
    }
  },
  mounted () {
    this.createMap()
  }

}
</script>

<style>

</style>
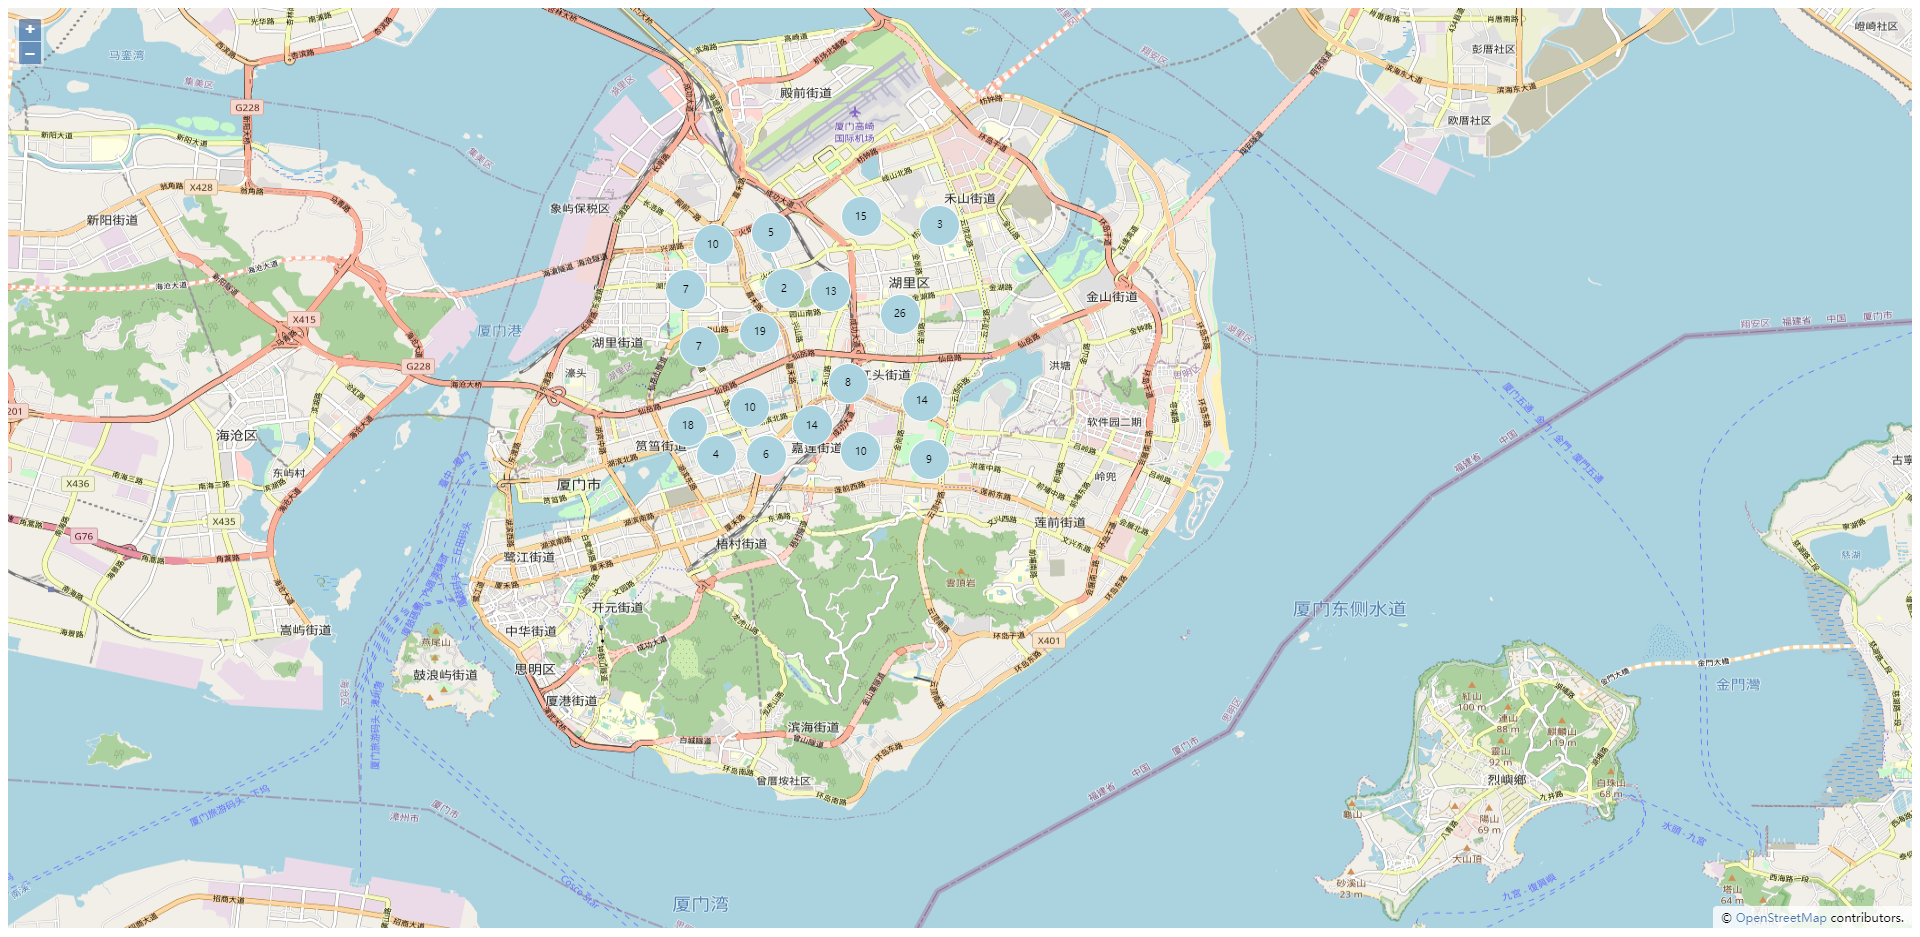
代码中已包含 Open Layers 组件的 点、线、面绘制以及聚合点展示,点、线、面绘制均由点击事件触发,可以在 handleClick 方法中打开或关闭。点聚合数据随机生成,在实际开发中由后端获取转成需要格式传入即可。handleClick 方法代码如下:
// 设置统一控制点击事件,需要画图方式在此处切换
handleClick(point) {
  // 绘制连线
  // this.drawLineString(point)
  // 绘制点
  // this.drawPoint(point)
  // 绘制圆形
  // this.drawCircle(point)
  // 绘制多边形
  // this.drawPolygon(point)
},
部分功能已添加样式处理,有特殊需求需要新建样式对象传入 feature。例如:
// 添加线的样式
let lineStyle = new Style({
  fill: new StyleFill({
    color: 'rgba(1, 210, 241, 0.1)'
  }),
  stroke: new StyleStroke({
    color: 'rgba(255, 0, 0)',
    width: 4,
  }),
});
feature.setStyle(lineStyle);
聚合点展示:

更多推荐
 已为社区贡献1条内容


所有评论(0)