使用helm快速安装 grafana&prometheus
heml可以说是的k8s集群的yum,javascript领域的npm,java领域的maven,golang领域的go mod,今天给大家介绍prometheus安装更改 grafana 服务暴露方式导出yaml配置文件更改服务暴露方式,更改将CluserIP更改为NodePort,并且指定端口号为: 31036应用配置文件查看grafana服务查看登陆密码:登陆访问:http://127.0.
系列文章目录
1、使用helm快速安装 grafana&prometheus
2、利用grafana&prometheus 快速配置 k8s & 主机监控
3、grafana&prometheus 快速配置报警规则及报警接收
前言
如何快速安装监控grafana&prometheus
Prometheus是一个开源监控解决方案,用于收集和聚合指标作为时间序列数据,内置了PromQL,允许用户实时选择和汇聚时间序列数据。我们可以直接把它当作时序数据库来用。
Grafana 是与Prometheus配合的可视化程序,它提供了强大和优雅的方式去创建、共享、浏览数据。利用它可以创建 不同metric数据源的优美 Dashboard,官方提供了多种成型Dashboard模板供你选择。
Helm可以说是的k8s集群的yum,javascript领域的npm,java领域的maven,golang领域的go mod,今天给大家介绍如何利用helm快速安装 grafana&prometheus。
一、安装helm
前置前提你的机器必须安装了k8s集群,就相当于你想安装maven你必须要先安装jvm/jdk一样。
[root@master ~]# wget https://get.helm.sh/helm-v3.4.0-rc.1-linux-amd64.tar.gz
[root@master ~]# tar xf helm-v3.4.0-rc.1-linux-amd64.tar.gz
[root@master ~]# mv linux-amd64/helm /usr/local/bin/
验证
[root@master ~]# helm help
The Kubernetes package manager
Common actions for Helm:
- helm search: search for charts
- helm pull: download a chart to your local directory to view
- helm install: upload the chart to Kubernetes
添加常用仓库
添加新的仓库地址
[root@master ~]# helm repo add stable https://kubernetes.oss-cn-hangzhou.aliyuncs.com/charts
[root@master ~]# helm repo add ali-incubator https://aliacs-app-catalog.oss-cn-hangzhou.aliyuncs.com/charts-incubator/
[root@master ~]# helm repo add apphub https://apphub.aliyuncs.com/
更新仓库
[root@master ~]# helm repo update
查看在存储库中可用的所有 Helm charts
[root@master ~]# helm search repo
一、安装应用
执行prometheus安装
helm install my apphub/prometheus
安装明细记录,记录下面后面需要使用:
NAME: my
LAST DEPLOYED: Sat Jun 25 09:17:18 2022
NAMESPACE: default
STATUS: deployed
REVISION: 1
TEST SUITE: None
NOTES:
The Prometheus server can be accessed via port 80 on the following DNS name from within your cluster:
my-prometheus-server.default.svc.cluster.local


Get the Prometheus server URL by running these commands in the same shell:
  export POD_NAME=$(kubectl get pods --namespace default -l "app=prometheus,component=server" -o jsonpath="{.items[0].metadata.name}")
  kubectl --namespace default port-forward $POD_NAME 9090


The Prometheus alertmanager can be accessed via port 80 on the following DNS name from within your cluster:
my-prometheus-alertmanager.default.svc.cluster.local


Get the Alertmanager URL by running these commands in the same shell:
  export POD_NAME=$(kubectl get pods --namespace default -l "app=prometheus,component=alertmanager" -o jsonpath="{.items[0].metadata.name}")
  kubectl --namespace default port-forward $POD_NAME 9093
#################################################################################
######   WARNING: Pod Security Policy has been moved to a global property.  #####
######            use .Values.podSecurityPolicy.enabled with pod-based      #####
######            annotations                                               #####
######            (e.g. .Values.nodeExporter.podSecurityPolicy.annotations) #####
#################################################################################


The Prometheus PushGateway can be accessed via port 9091 on the following DNS name from within your cluster:
my-prometheus-pushgateway.default.svc.cluster.local


Get the PushGateway URL by running these commands in the same shell:
  export POD_NAME=$(kubectl get pods --namespace default -l "app=prometheus,component=pushgateway" -o jsonpath="{.items[0].metadata.name}")
  kubectl --namespace default port-forward $POD_NAME 9091

For more information on running Prometheus, visit:
https://prometheus.io/
helm install mygrafana apphub/grafana
NAME: mygrafana
LAST DEPLOYED: Sat Jun 25 09:20:10 2022
NAMESPACE: default
STATUS: deployed
REVISION: 1
NOTES:
1. Get your 'admin' user password by running:

   kubectl get secret --namespace default mygrafana -o jsonpath="{.data.admin-password}" | base64 --decode ; echo

2. The Grafana server can be accessed via port 80 on the following DNS name from within your cluster:

   mygrafana.default.svc.cluster.local

   Get the Grafana URL to visit by running these commands in the same shell:

     export POD_NAME=$(kubectl get pods --namespace default -l "app=grafana,release=mygrafana" -o jsonpath="{.items[0].metadata.name}")
     kubectl --namespace default port-forward $POD_NAME 3000

3. Login with the password from step 1 and the username: admin
#################################################################################
######   WARNING: Persistence is disabled!!! You will lose your data when   #####
######            the Grafana pod is terminated.                            #####
#################################################################################
更改 grafana 服务暴露方式
导出yaml配置文件
kubectl get service mygrafana -o yaml > mygrafana.yaml
更改服务暴露方式,更改将CluserIP更改为NodePort,并且指定端口号为: 31036
apiVersion: v1
kind: Service
metadata:
  annotations:
    meta.helm.sh/release-name: mygrafana
    meta.helm.sh/release-namespace: default
  creationTimestamp: "2022-06-25T01:20:11Z"
  labels:
    app: grafana
    app.kubernetes.io/managed-by: Helm
    chart: grafana-4.6.3
    heritage: Helm
    release: mygrafana
  name: mygrafana
  namespace: default
  resourceVersion: "5807668"
  uid: e8fd4ab7-faf0-4328-ad5b-fa5c96820b25
spec:
  clusterIP: 10.233.60.69
  clusterIPs:
  - 10.233.60.69
  ipFamilies:
  - IPv4
  ipFamilyPolicy: SingleStack
  ports:
  - name: service
    port: 80
    protocol: TCP
    targetPort: 3000
    nodePort: 31036
  selector:
    app: grafana
    release: mygrafana
  sessionAffinity: None
  type: NodePort
status:
  loadBalancer: {}
应用配置文件
kubectl apply -f mygrafana.yaml
service/mygrafana configured
查看grafana服务
查看登陆密码:
kubectl get secret --namespace default mygrafana -o jsonpath="{.data.admin-password}" | base64 --decode ; echo
JV3efD8S7xQdjhTkPJTtbefoJ5nl4L6mY2wlt8IS
登陆访问:
http://127.0.0.1:31036
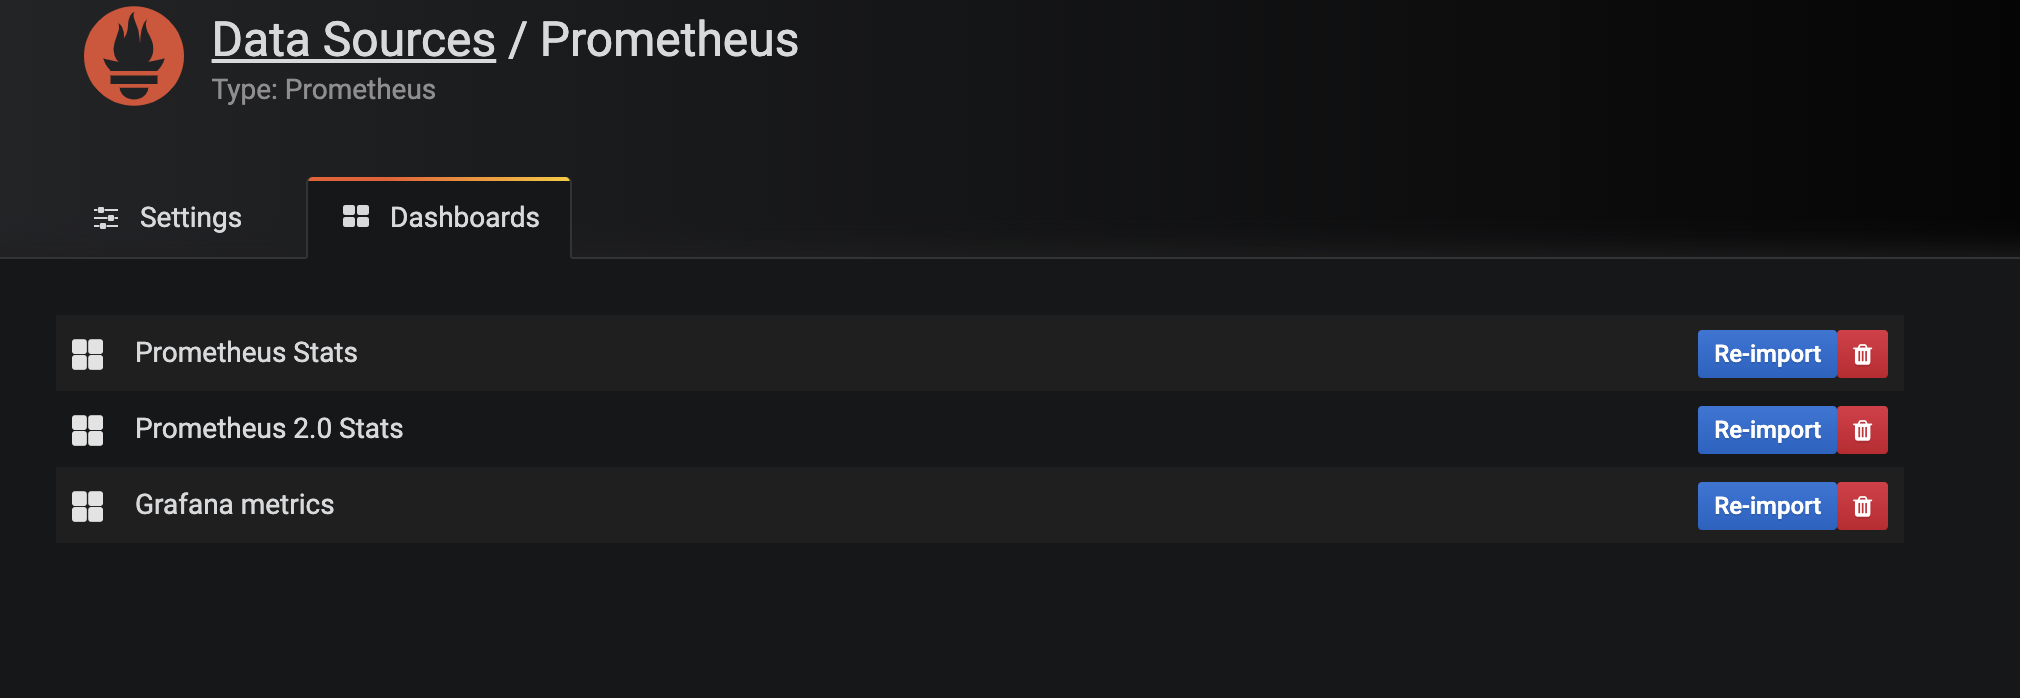
添加访问数据源:Prometheus
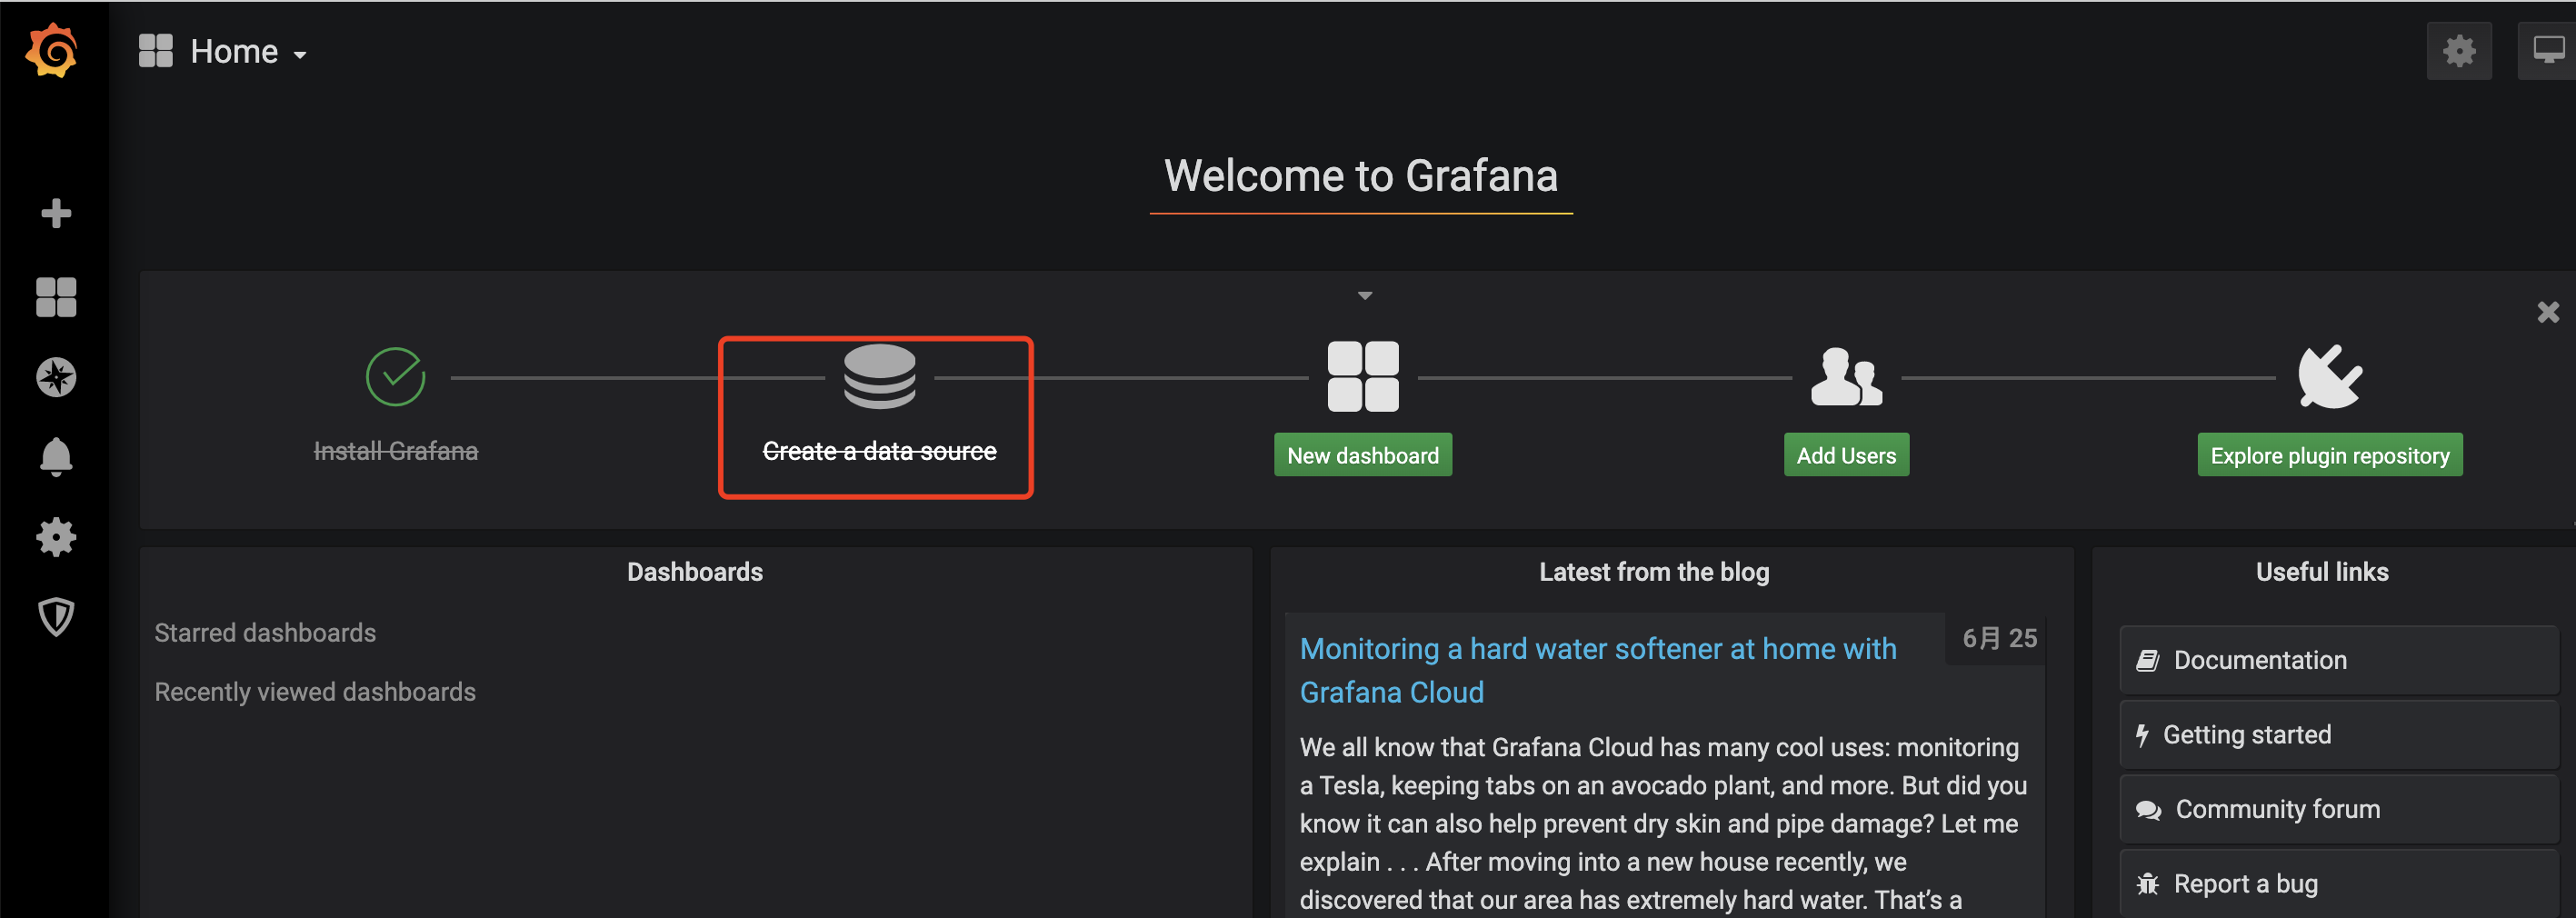
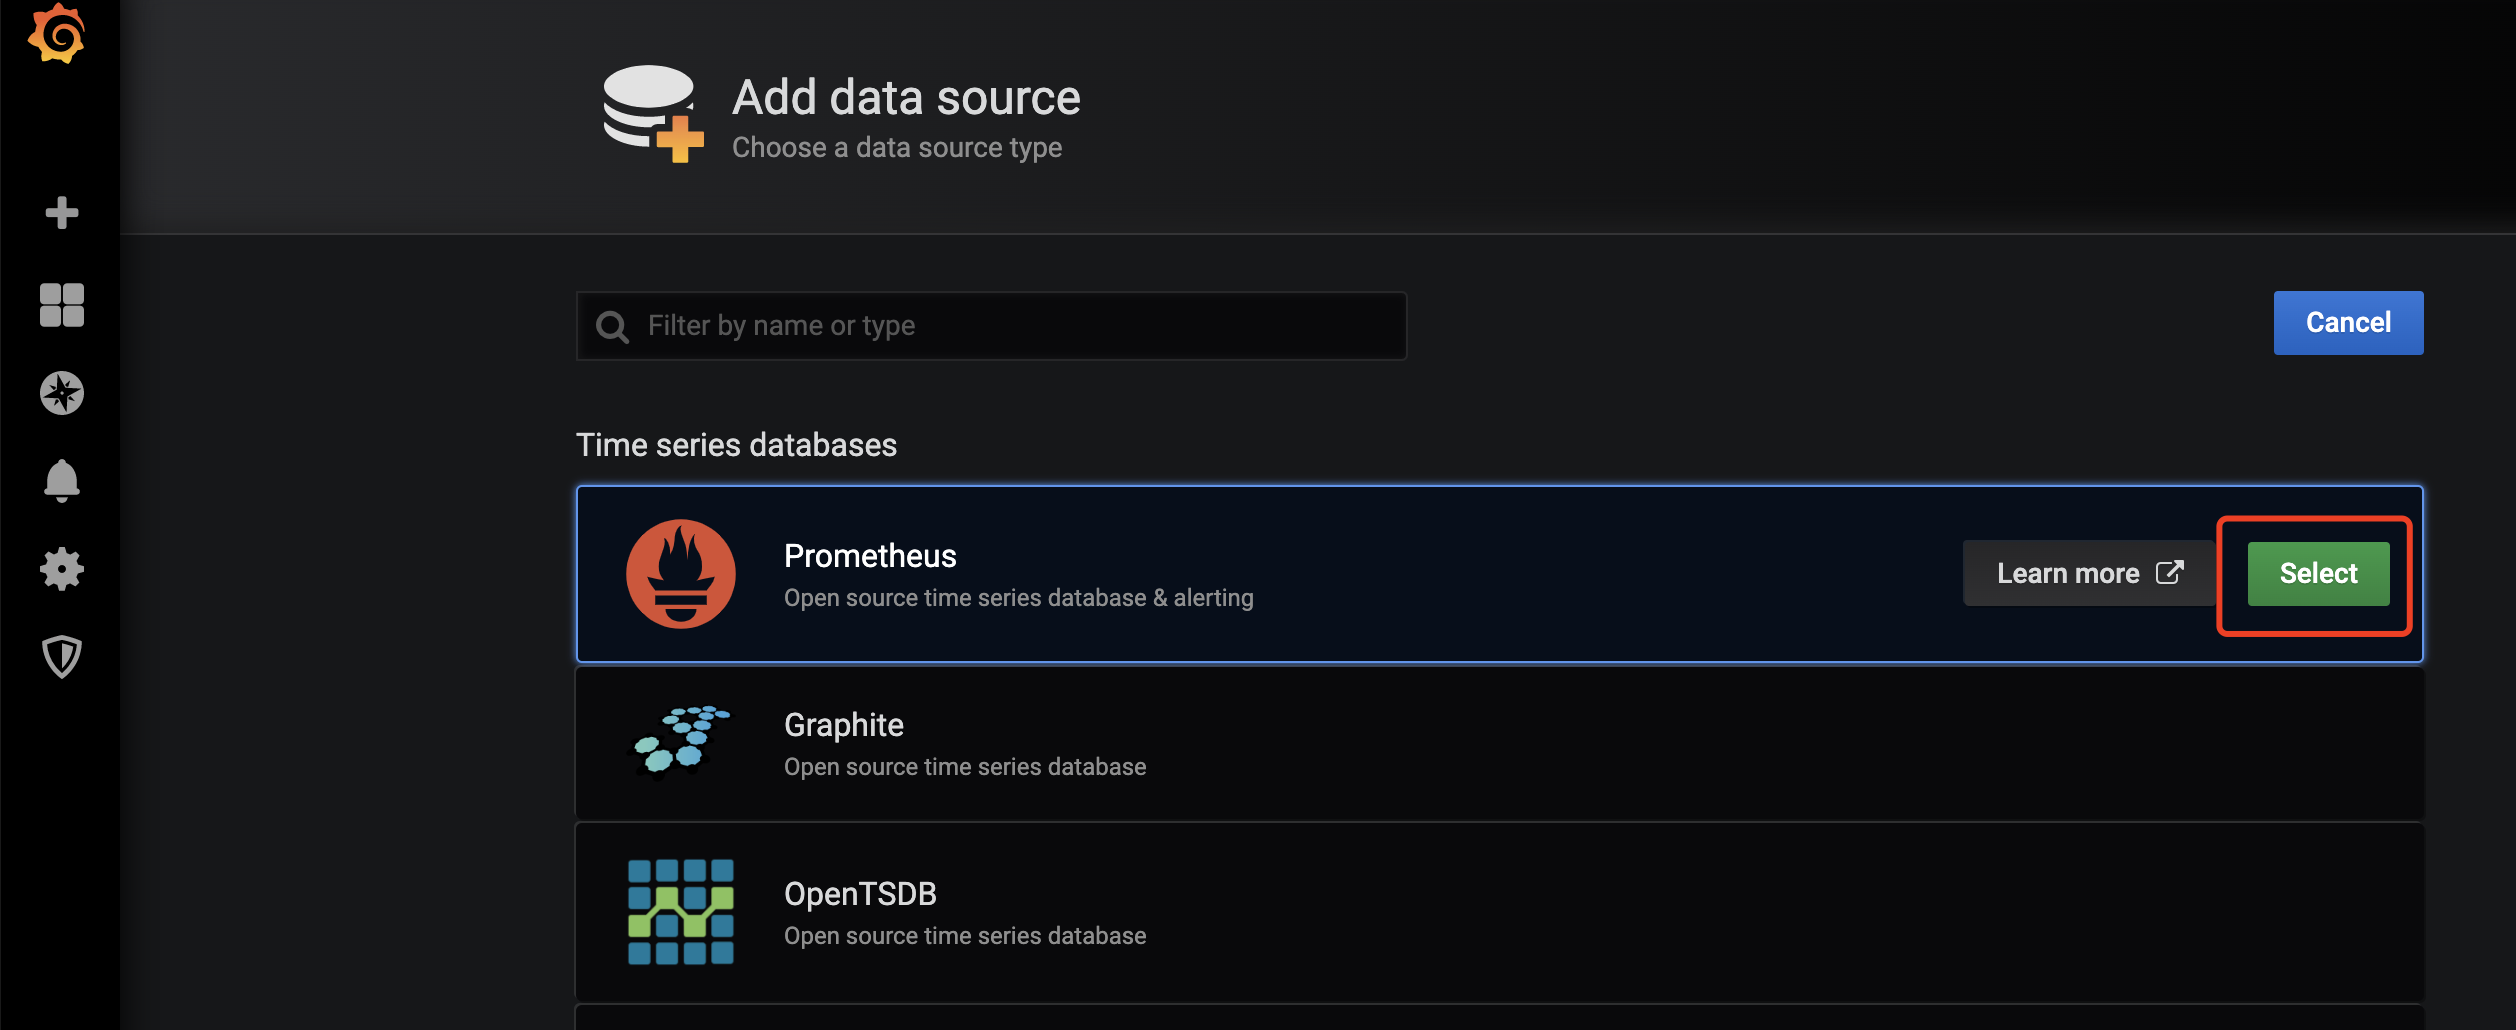
添加prometheus-3数据源
root@master:~$ kubectl get svc
NAME TYPE CLUSTER-IP EXTERNAL-IP PORT(S) AGE
kubernetes ClusterIP 10.233.0.1 <none> 443/TCP 19d
my-prometheus-alertmanager ClusterIP 10.233.54.95 <none> 80/TCP 68m
my-prometheus-kube-state-metrics ClusterIP None <none> 80/TCP,81/TCP 68m
my-prometheus-node-exporter ClusterIP None <none> 9100/TCP 68m
my-prometheus-pushgateway ClusterIP 10.233.33.142 <none> 9091/TCP 68m
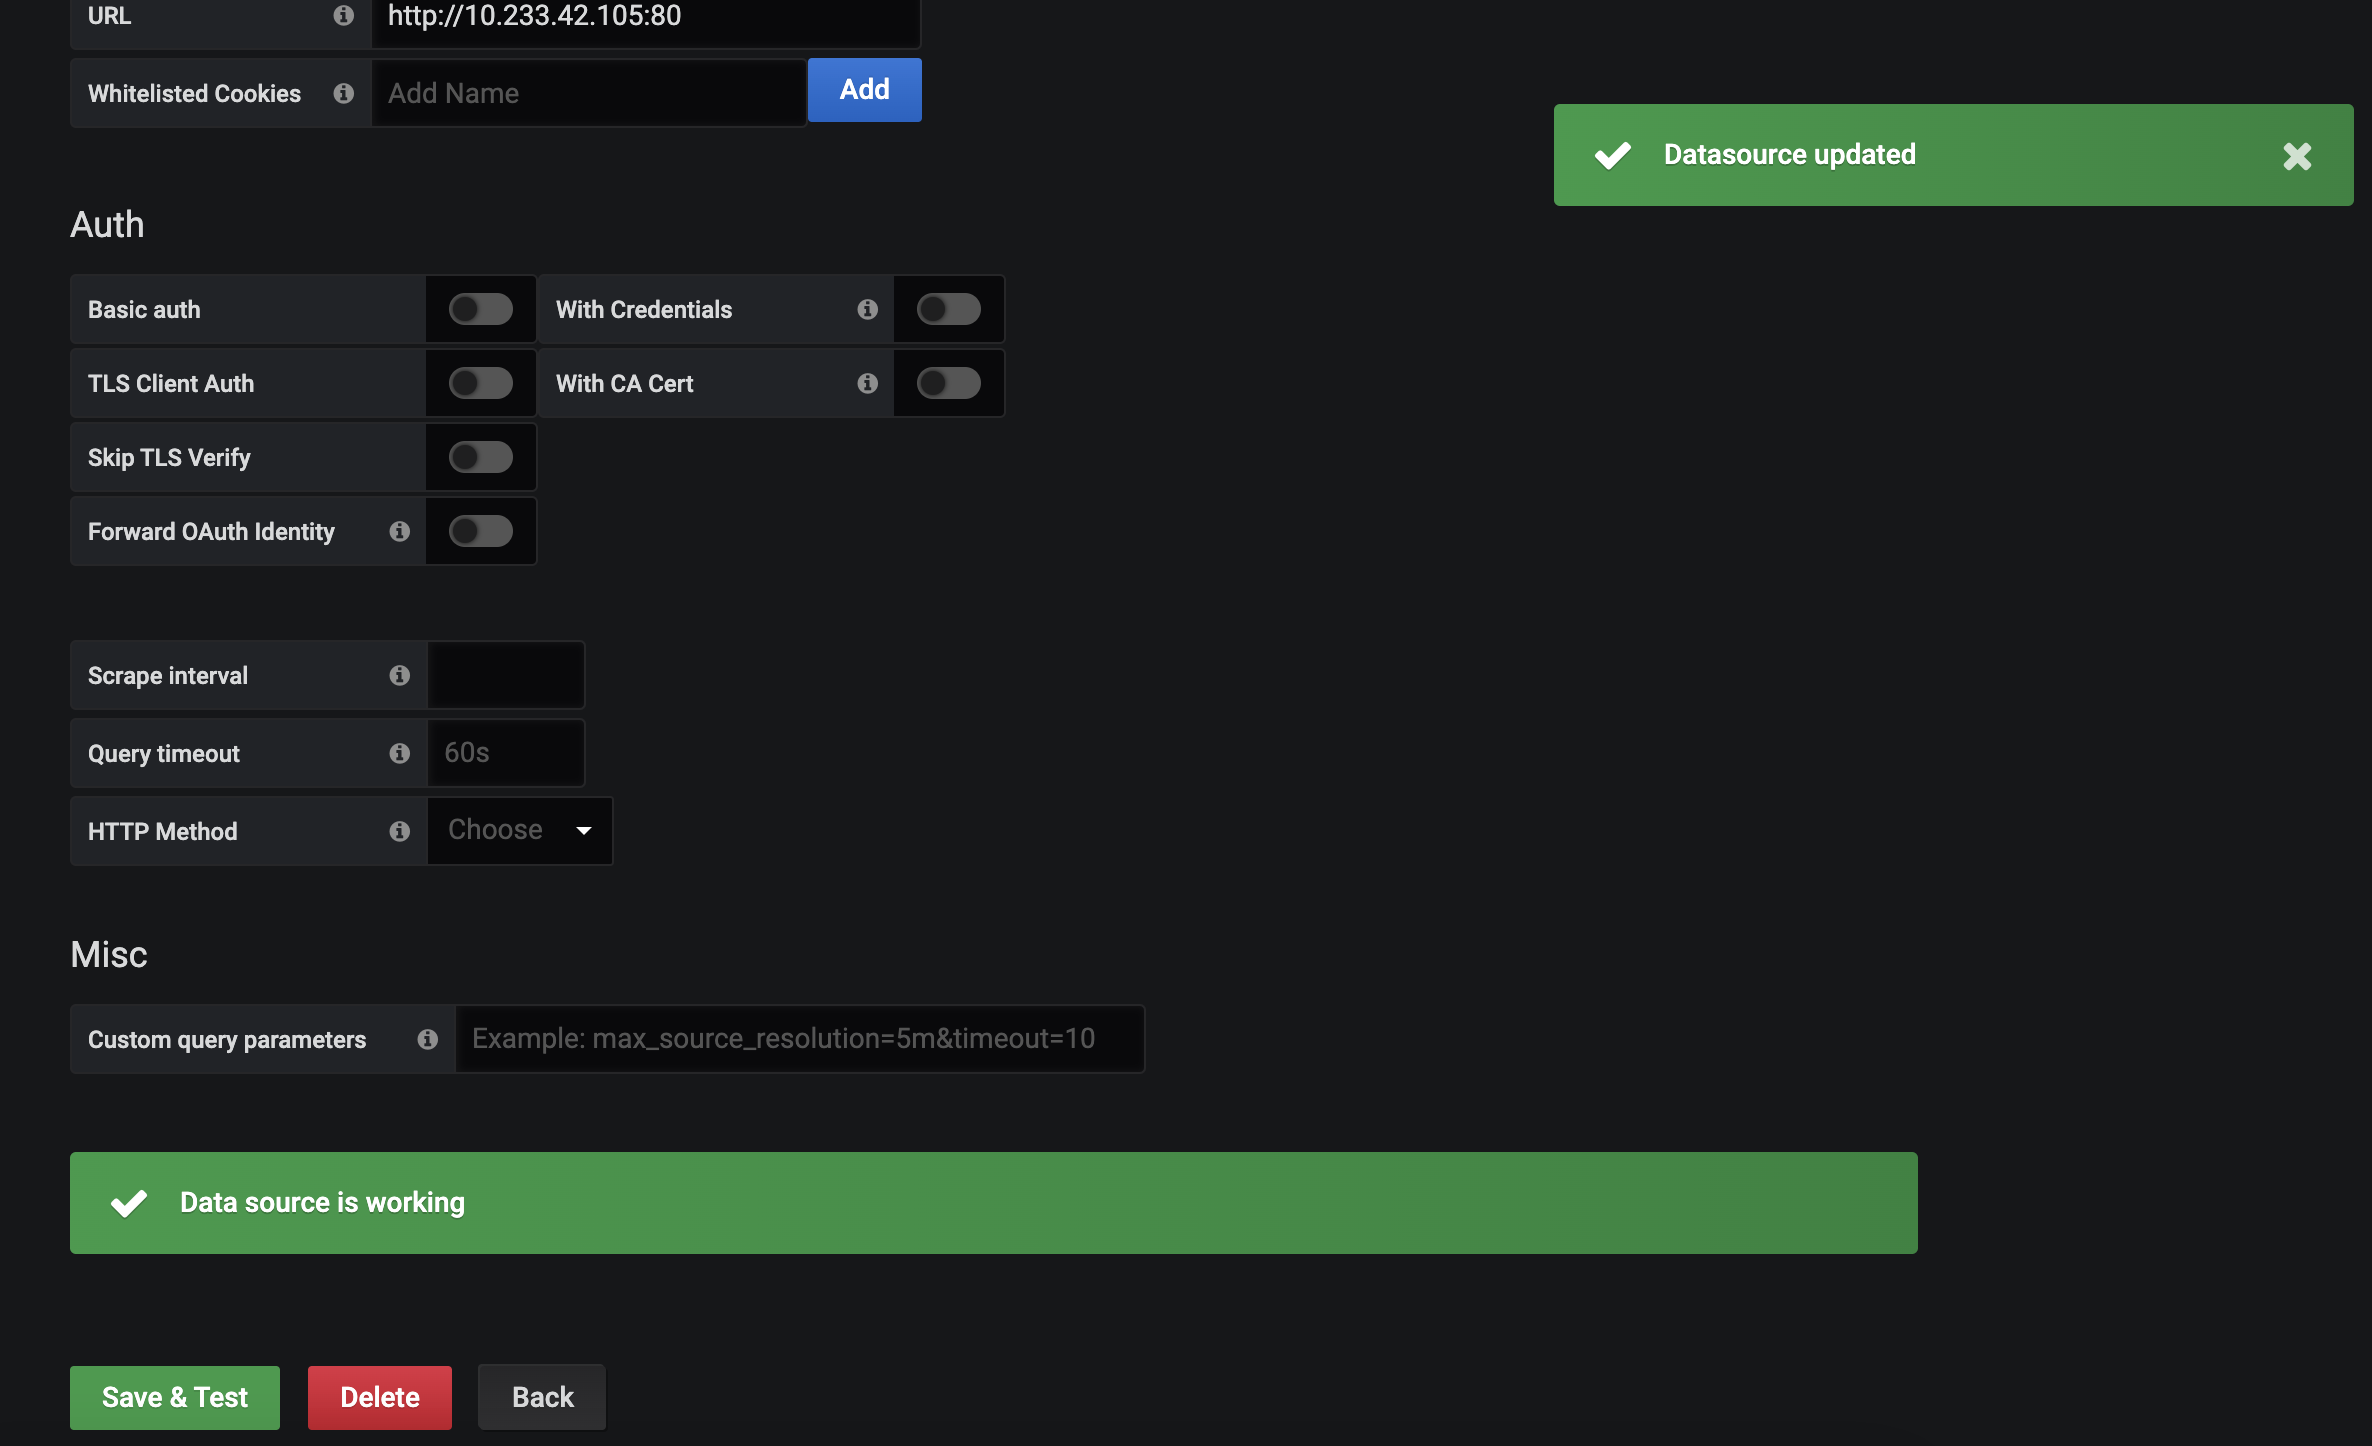
my-prometheus-server NodePort 10.233.42.105 <none> 80:30241/TCP 68m
mygrafana NodePort 10.233.60.69 <none> 80:31036/TCP 65m
my-prometheus-server对应的ClusterIP+端口80就是对应URL地址
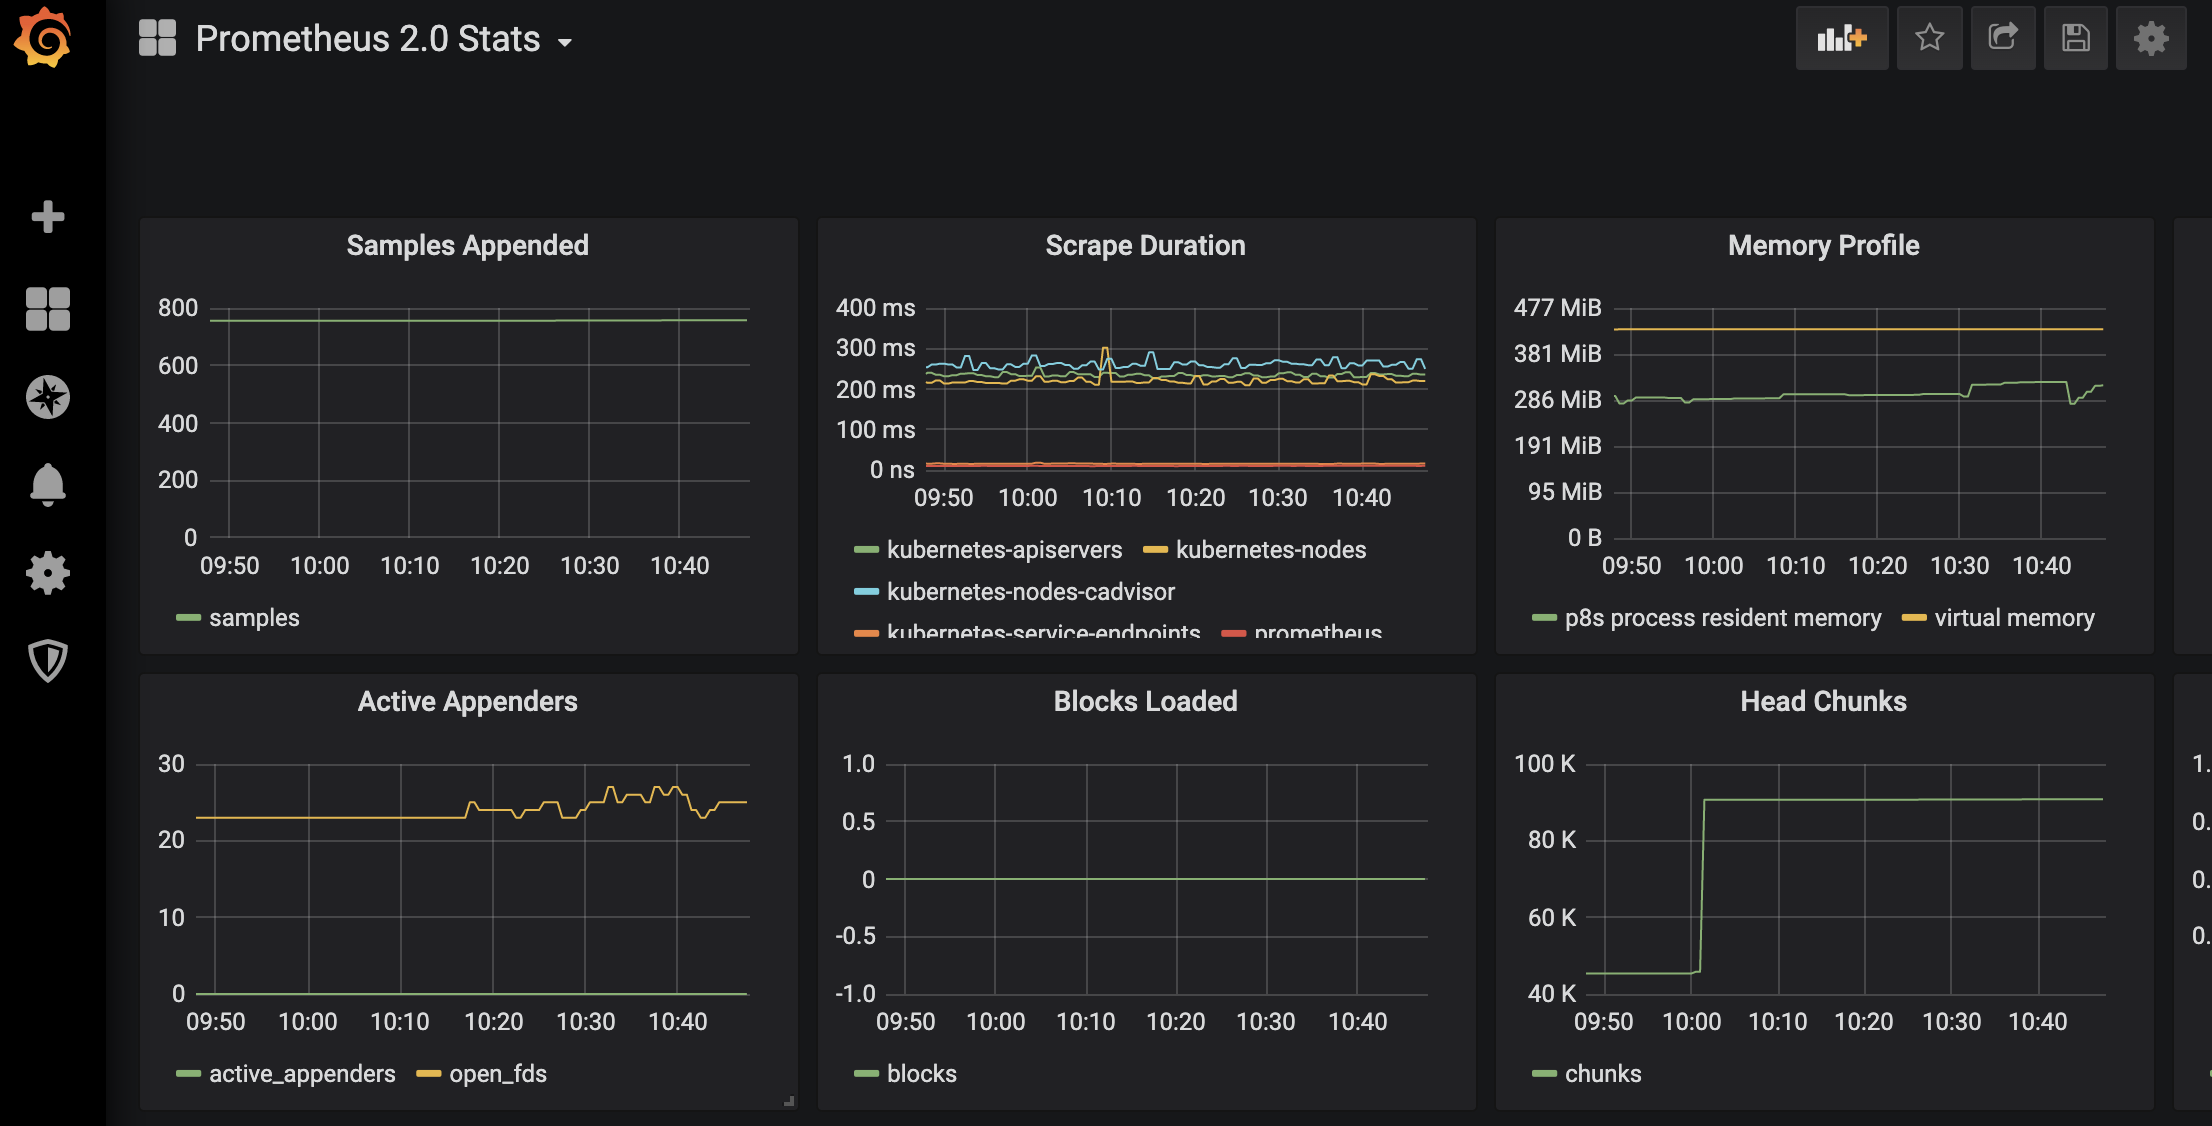
配置dashborad 2.0
查看结果:
后续工作
安装完毕服务了后续我们要做的有哪些呢?
1、k8s 服务面板设置
1、node服务监控
2、pod容器监控
3、其他服务监控

为开发者提供学习成长、分享交流、生态实践、资源工具等服务,帮助开发者快速成长。
更多推荐


 0
0 0
0- 0


 已为社区贡献2条内容

所有评论(0)