vue中使用echarts实现柱状图点击事件
drawBar(){ // 告警次数TOPN 柱状图// 基于准备好的dom,初始化echarts实例let ref = this.$refs.barif (ref && ref !== undefined) {let myChart = this.$echarts.init(ref)// 绘制图表myChart.setOption({color: ['#f16e6b'],tool
drawBar(){ // 告警次数TOPN 柱状图
// 基于准备好的dom,初始化echarts实例
let ref = this.$refs.bar
if (ref && ref !== undefined) {
let myChart = this.$echarts.init(ref)
// 绘制图表
myChart.setOption({
color: ['#f16e6b'],
tooltip: {
trigger: 'axis',
axisPointer: { // 坐标轴指示器,坐标轴触发有效
type: 'shadow' // 默认为直线,可选为:'line' | 'shadow'
}
},
grid: {
left: '10%',
right: '10%',
bottom: '3%',
containLabel: true
},
xAxis: [
{
type: 'category',
data: this.date_x,
name: '终端编号'
}
],
yAxis: [
{
type: 'value'
}
],
series: [
{
type: 'bar',
stack: '告警',
data: this.date_y
}
]
});
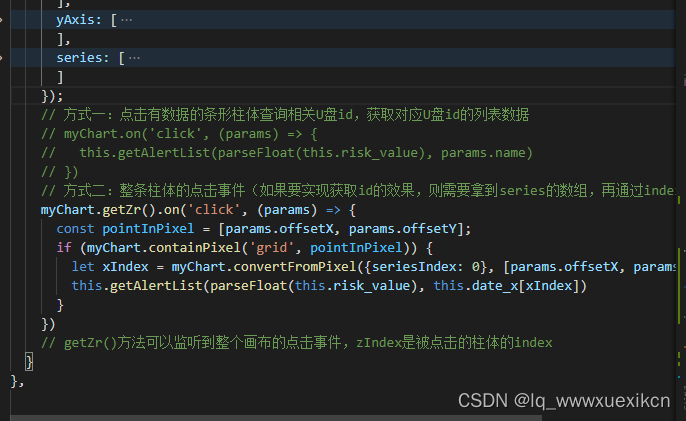
// 方式一:点击有数据的条形柱体查询相关U盘id,获取对应U盘id的列表数据
// myChart.on('click', (params) => {
// this.getAlertList(parseFloat(this.risk_value), params.name)
// })
// 方式二:整条柱体的点击事件(如果要实现获取id的效果,则需要拿到series的数组,再通过index拿到对应的数据对象)
myChart.getZr().on('click', (params) => {
const pointInPixel = [params.offsetX, params.offsetY];
if (myChart.containPixel('grid', pointInPixel)) {
let xIndex = myChart.convertFromPixel({seriesIndex: 0}, [params.offsetX, params.offsetY])[0]
this.getAlertList(parseFloat(this.risk_value), this.date_x[xIndex])
}
})
// getZr()方法可以监听到整个画布的点击事件,zIndex是被点击的柱体的index
}
},


前往低代码交流专区
更多推荐

 0
0 0
0- 0


 已为社区贡献1条内容

所有评论(0)