在vue项目中简单使用Echarts&第一次使用时的各种报错与解决
关于echarts安装版本报错的解决办法,关于Uncaught (in promise) TypeError: Cannot read properties of null (reading 'getAttribute')错误的解决办法
npm安装Echarts
npm install echarts --save
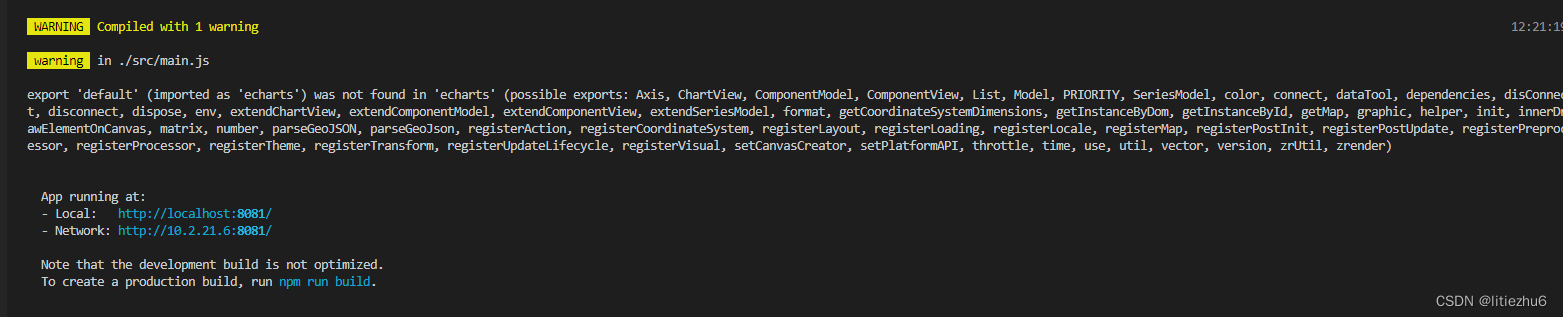
注意 :2022年后安装的echarts都是5.X版本,可以在package.json中看到,不知为何,这个和Vue项目不匹配,在运行npm run serve时导致发生错误:

此时我们可以卸载最新版本,安装旧版本:如:4.9.0 等等
npm install echarts@4.9.0
此时我们再运行 npm run serve 后 发现可以正常启动了
在main.js中全局导入Echarts
import echarts from 'echarts'
Vue.prototype.$echarts = echarts
在组件中简单使用
在<template>中定义dom元素
<div id="main" style="width: 600px; height: 400px"></div>注意:div用于生成 echarts图形,css中一定要加长与宽,因为如果不加宽高,生成echart图形时不会显现出来。
在 <script> 中定义事件
export default {
  created() {
    this.location();
  },
  methods: {
    location() {
        //创建 id为main的dom对象
      let myChart = this.$echarts.init(document.querySelector("#main"));
    },
  },
};
</script>
此时我们发现会报错:
Uncaught (in promise) TypeError: Cannot read properties of null (reading 'getAttribute')
意思为:未捕获(承诺中)TypeError:无法读取null的属性(读取“getAttribute”)
分析:created调用location事件时获取dom对象,是不行的,因为在created钩子函数中是获取不到dom的,我们可以使用mounted钩子替换成created钩子
export default {
  mounted() {
    this.location();
  },
  methods: {
    location() {
        //创建 id为main的dom对象
      let myChart = this.$echarts.init(document.querySelector("#main"));
    },
  },
};
</script>
随后在在mychartdom对象中绘制图表
export default {
  data() {
    return {};
  },
  mounted() {
    this.location();
  },
  methods: {
    location() {
      // console.log(this.$echarts.init);
      let myChart = this.$echarts.init(document.querySelector("#main"));
      // 绘制图表;
      myChart.setOption({
        title: {
          text: "ECharts 入门示例",
        },
        tooltip: {},
        xAxis: {
          data: ["衬衫", "羊毛衫", "雪纺衫", "裤子", "高跟鞋", "袜子"],
        },
        yAxis: {},
        series: [
          {
            name: "销量",
            type: "bar",
            data: [5, 20, 36, 10, 10, 20],
          },
        ],
      });
    },
  },
};
</script>
这时候页面就展示出来了

更多样式可参考官网:ECharts官网

前往低代码交流专区
更多推荐

 0
0 0
0- 0


 已为社区贡献5条内容

所有评论(0)