实战:prometheus部署到k8s综合案例演示-2022.4.29
实验软件链接:https://pan.baidu.com/s/12jfLts2wtJQUvT3WrD9EJg?pwd=rbvo提取码:rbvo2022.4.29-p8s综合应用demo-code前置条件具有k8s环境:k8s:v1.22.2,containerd:1.5.5具有p8s环境:prometheus-2.35.0具有go环境:go1.16.2比如我们在本地启动一些样例来让 Prometh

实验软件
链接:https://pan.baidu.com/s/12jfLts2wtJQUvT3WrD9EJg?pwd=rbvo
提取码:rbvo
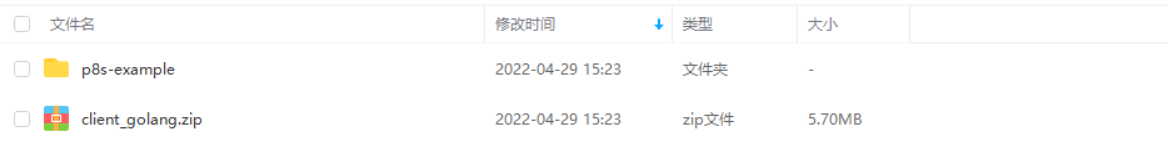
2022.4.29-p8s综合应用demo-code
前置条件
具有k8s环境:k8s:v1.22.2,containerd:1.5.5
具有p8s环境:prometheus-2.35.0
具有go环境:go1.16.2
比如我们在本地启动一些样例来让 Prometheus 采集。Go 客户端库包含一个示例,该示例为具有不同延迟分布的三个服务暴露 RPC 延迟。
1、下载 Prometheus 的 Go 客户端库并运行示例
- 首先确保已经安装了 Go 环境并启用 go modules,下载 Prometheus 的 Go 客户端库并运行这三个示例:
至于,如何在linux上安装go环境,可以查看我的另一篇文章:
https://blog.csdn.net/weixin_39246554/article/details/124495828?spm=1001.2014.3001.5502
(1)下载源代码
[root@master1 ~]#git clone https://github.com/prometheus/client_golang.git
[root@master1 ~]#cd client_golang/examples/random/
[root@master1 random]#ls
main.go

(2)编译生成二进制文件
[root@master1 random]#go build
go: downloading github.com/beorn7/perks v1.0.1
go: downloading github.com/cespare/xxhash/v2 v2.1.2
go: downloading github.com/golang/protobuf v1.5.2
go: downloading github.com/prometheus/client_model v0.2.0
go: downloading github.com/prometheus/common v0.33.0
go: downloading github.com/prometheus/procfs v0.7.3
go: downloading google.golang.org/protobuf v1.28.0
go: downloading github.com/matttproud/golang_protobuf_extensions v1.0.1
go: downloading golang.org/x/sys v0.0.0-20220328115105-d36c6a25d886
[root@master1 random]#ll -h
total 12M
-rw-r--r-- 1 root root 4.5K Apr 28 16:52 main.go
-rwxr-xr-x 1 root root  12M Apr 28 16:56 random
- 然后在3个独立的终端里面运行3个服务:
./random -listen-address=:8080
./random -listen-address=:8081
./random -listen-address=:8082
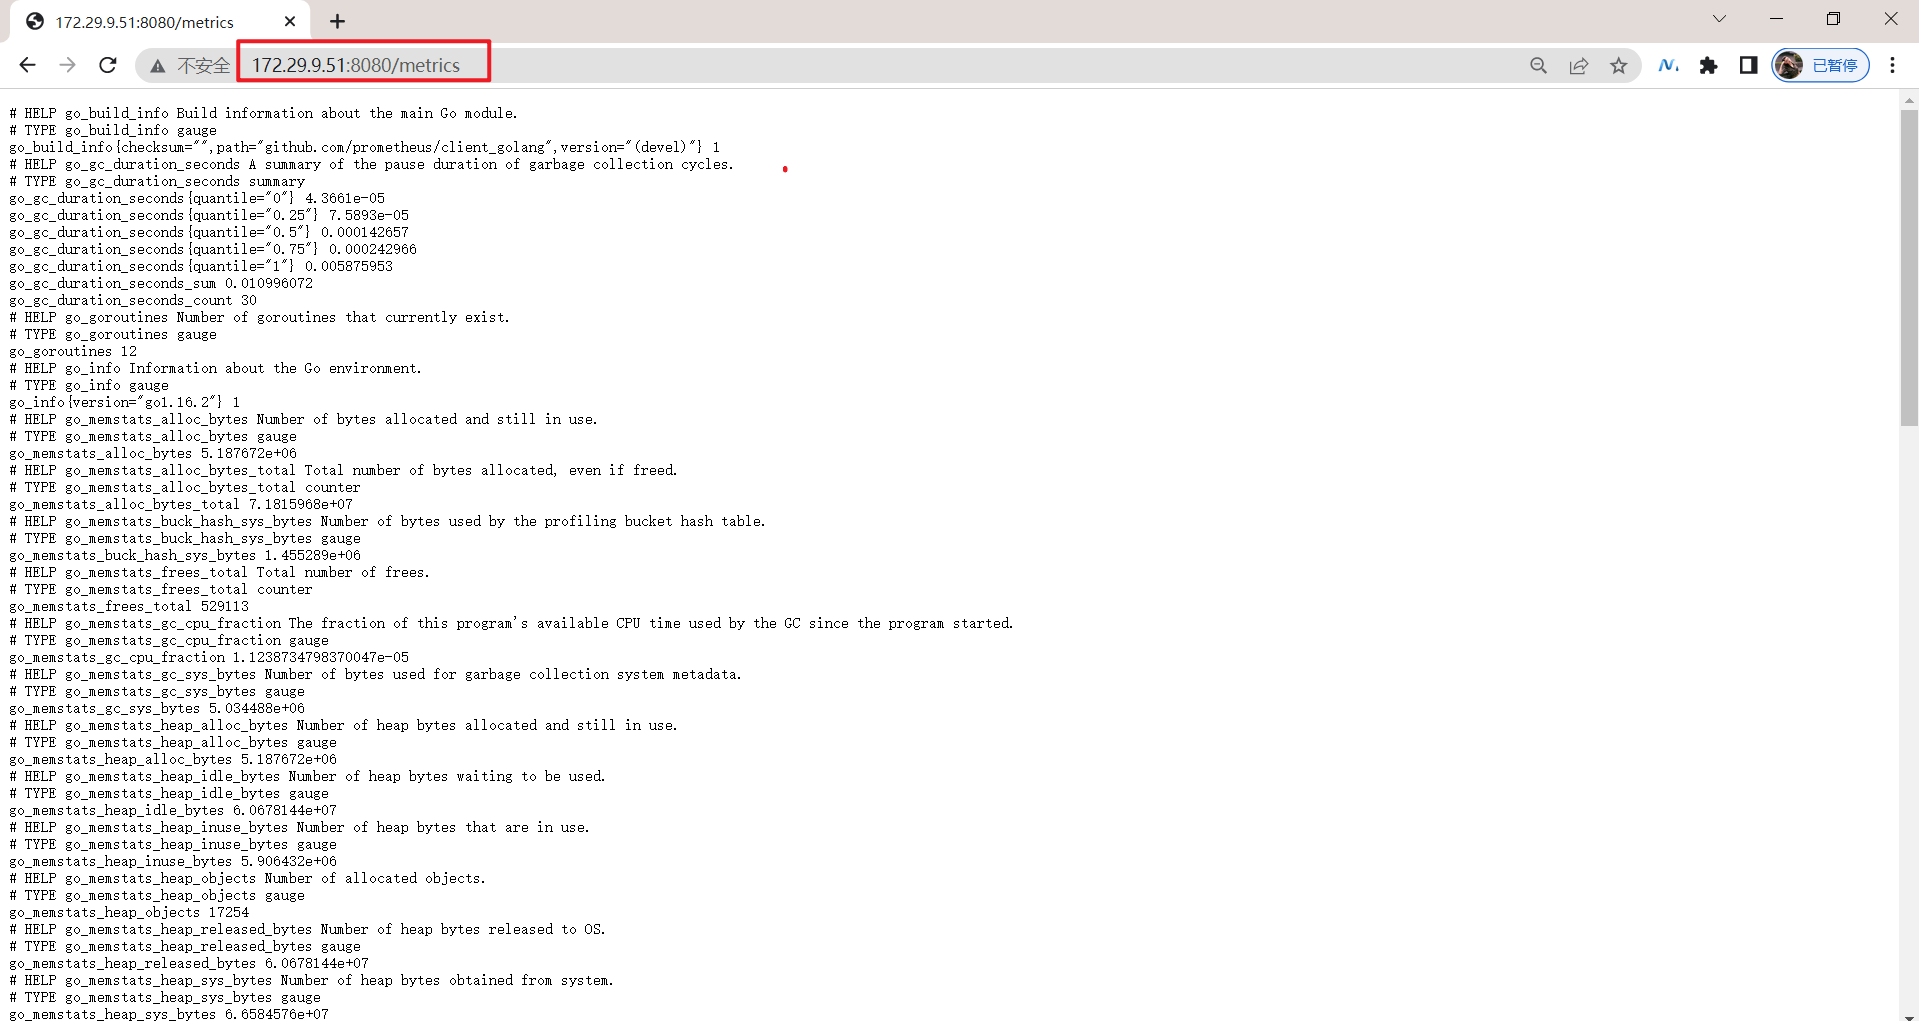
这个时候我们可以得到3个不同的监控接口:http://localhost:8080/metrics、http://localhost:8081/metrics 和 http://localhost:8082/metrics。
2、配置p8s server的 prometheus.yml文件
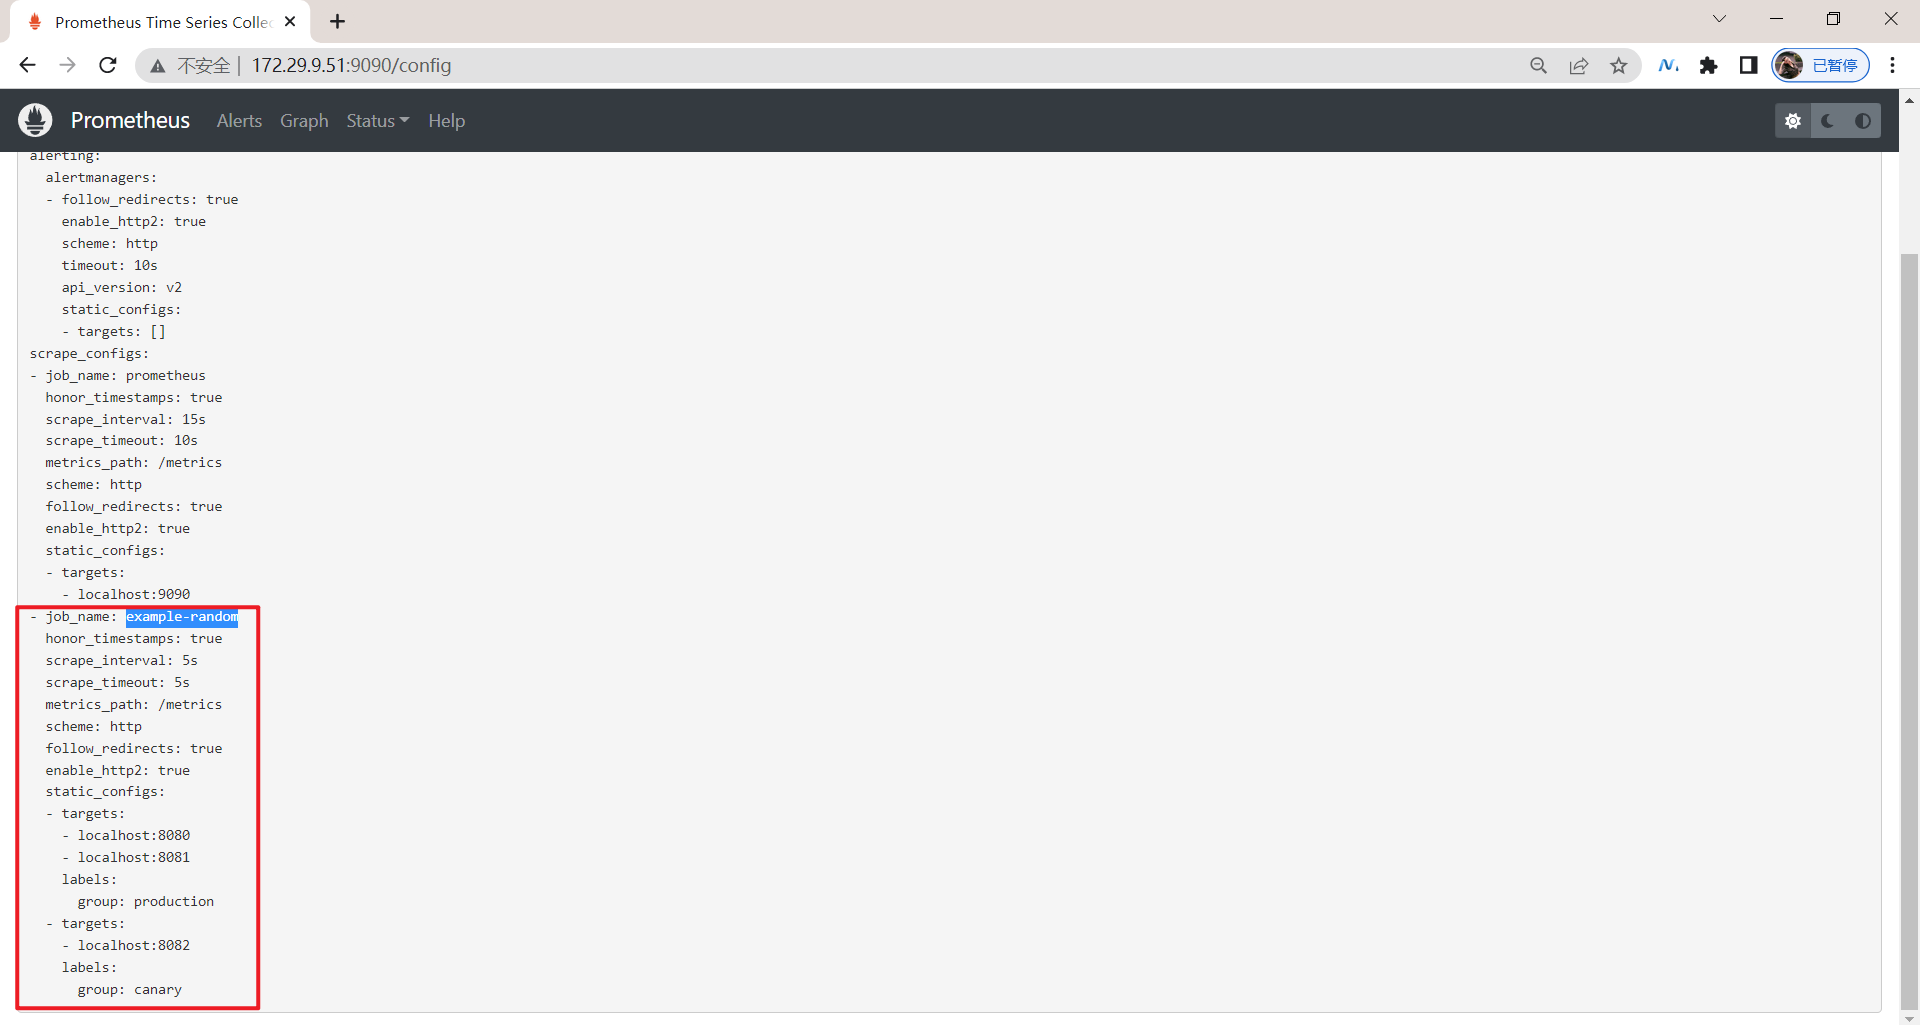
现在我们配置 Prometheus 来采集这些新的目标,让我们将这三个目标分组到一个名为 example-random 的任务。假设前两个端点(即:http://localhost:8080/metrics、http://localhost:8081/metrics )都是生产级目标应用,第三个端点(即:http://localhost:8082/metrics )为金丝雀实例。要在 Prometheus 中对此进行建模,我们可以将多组端点添加到单个任务中,为每组目标添加额外的标签。 在此示例中,我们将 group =“production” 标签添加到第一组目标,同时将 group=“canary”添加到第二组。将以下配置添加到 prometheus.yml 中的 scrape_configs 部分,然后重新启动 Prometheus 实例:
[root@master1 ~]#cd prometheus-2.35.0.linux-amd64/
[root@master1 prometheus-2.35.0.linux-amd64]#ls
console_libraries  consoles  data  LICENSE  NOTICE  prometheus  prometheus.yml  promtool

[root@master1 prometheus-2.35.0.linux-amd64]#vim prometheus.yml
scrape_configs:
  - job_name: 'example-random'
    # Override the global default and scrape targets from this job every 5 seconds.
    scrape_interval: 5s
    static_configs:
      - targets: ['localhost:8080', 'localhost:8081']
        labels:
          group: 'production'
      - targets: ['localhost:8082']
        labels:
          group: 'canary'
3、验证
修改完prometheus.yml配置文件后,我们重启下prometheus。以上就是添加监控配置最基本的配置方式了,非常简单,只需要提供一个符合 metrics 格式的可访问的接口配置给 Prometheus 就可以了。
4、将Prometheus 的 Go 客户端库demo部署在k8s里
但是由于我们这里是要运行在 Kubernetes 系统中,所以我们直接用 Docker 镜像的方式运行。
1.创建monitor命名空间
- 为了方便管理,我们将监控相关的所有资源对象都安装在
monitor这个 namespace 下面,没有的话可以提前创建。
[root@master1 ~]#kubectl create ns monitor
namespace/monitor created
2.将 prometheus.yml 文件用 ConfigMap 的形式进行管理
本次实验目录如下:
[root@master1 ~]#mkdir p8s-example
[root@master1 ~]#cd p8s-example/
- 为了能够方便的管理配置文件,我们这里将
prometheus.yml文件用 ConfigMap 的形式进行管理:
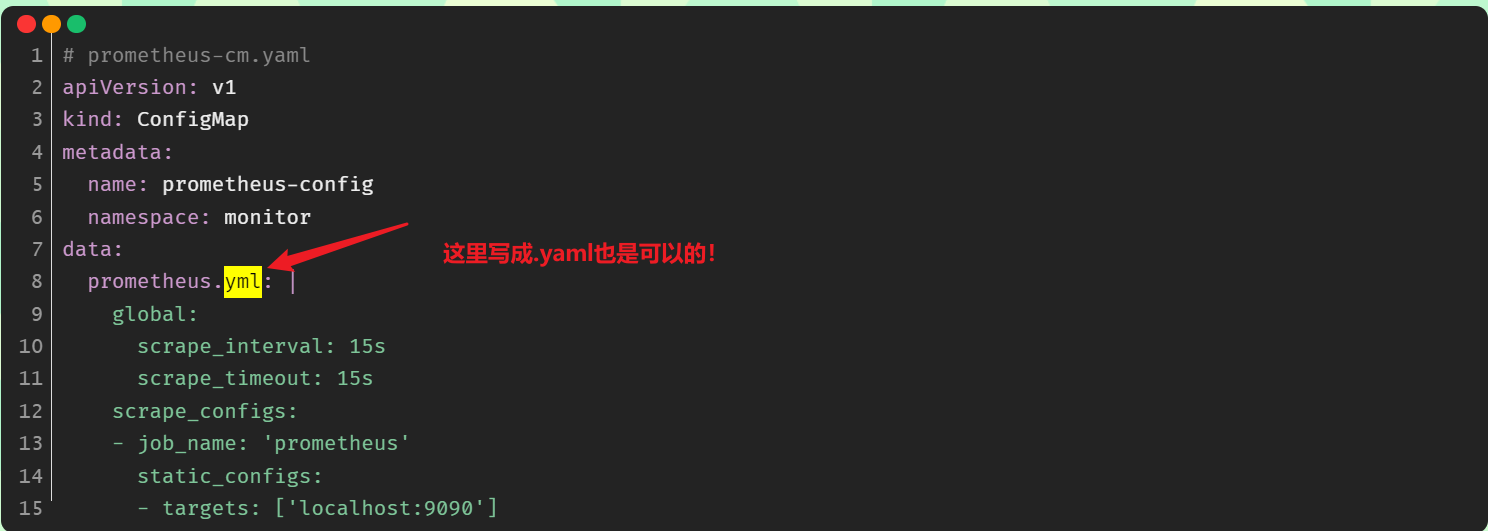
[root@master1 p8s-example**]**#vim prometheus-cm.yaml
# prometheus-cm.yaml
apiVersion: v1
kind: ConfigMap
metadata:
  name: prometheus-config
  namespace: monitor
data:
  prometheus.yml: |
    global:
      scrape_interval: 15s
      scrape_timeout: 15s
    scrape_configs:
    - job_name: 'prometheus'
      static_configs:
      - targets: ['localhost:9090']
注意:
3.创建prometheus 的 Pod 资源
现在我们来创建 prometheus 的 Pod 资源:
[root@master1 p8s-example**]**#vim prometheus-deploy.yaml
# prometheus-deploy.yaml
apiVersion: apps/v1
kind: Deployment
metadata:
  name: prometheus
  namespace: monitor
  labels:
    app: prometheus
spec:
  selector:
    matchLabels:
      app: prometheus
  template:
    metadata:
      labels:
        app: prometheus
    spec:
      serviceAccountName: prometheus
      containers:
      - image: prom/prometheus:v2.34.0
        name: prometheus
        args:
        - "--config.file=/etc/prometheus/prometheus.yml"
        - "--storage.tsdb.path=/prometheus"  # 指定tsdb数据路径
        - "--storage.tsdb.retention.time=24h" #保存时间
        - "--web.enable-admin-api"  # 控制对admin HTTP API的访问,其中包括删除时间序列等功能
        - "--web.enable-lifecycle"  # 支持热更新,直接执行localhost:9090/-/reload立即生效
        ports:
        - containerPort: 9090
          name: http
        volumeMounts:
        - mountPath: "/etc/prometheus"
          name: config-volume
        - mountPath: "/prometheus"
          name: data
        resources:
          requests:
            cpu: 100m
            memory: 512Mi
          limits:
            cpu: 100m
            memory: 512Mi
      volumes:
      - name: data #tsdb数据路径:/prometheus,这里使用的是pvc
        persistentVolumeClaim:
          claimName: prometheus-data
      - configMap: #
          name: prometheus-config
        name: config-volume
…… #上面突然写成那种我还看不懂了哈哈……老铁,没毛病!
      volumes: #这里要再次熟悉下关于volumes/volumeMounts数据卷挂载的使用方法!!!
      - name: data #tsdb数据路径:/prometheus,这里使用的是pvc
        persistentVolumeClaim:
          claimName: prometheus-data
      - name: config-volume
      	configMap: #
          name: prometheus-config
另外为了 prometheus 的性能和数据持久化我们这里是直接将通过一个 LocalPV 来进行数据持久化的,通过 --storage.tsdb.path=/prometheus 指定数据目录。
4.创建prometheus的pv/pvc资源
创建如下所示的一个 PVC 资源对象,注意是一个 LocalPV,和 node1 节点具有亲和性:
- 先在宿主机node1节点上上创建这个下面LocalPV要使用到的本地目录:
[root@master1 ~]#ssh node1
Last login: Fri Apr 29 09:57:06 2022 from master1
[root@node1 ~]#mkdir -p  /data/k8s/prometheus
- 创建prometheus-pvc.yaml文件:
[root@master1 p8s-example**]**#vim prometheus-pvc.yaml
#prometheus-pvc.yaml
apiVersion: v1
kind: PersistentVolume
metadata:
  name: prometheus-local
  labels:
    app: prometheus
spec:
  accessModes:
  - ReadWriteOnce
  capacity:
    storage: 20Gi
  storageClassName: local-storage
  local:
    path: /data/k8s/prometheus #一定要先在宿主机上创建这个目录!!!
  nodeAffinity: #pv也是可以配置节点亲和性的哦!!!
    required:
      nodeSelectorTerms:
      - matchExpressions:
        - key: kubernetes.io/hostname
          operator: In
          values:
          - node1 #这里是自己的node1节点
  persistentVolumeReclaimPolicy: Retain
---
apiVersion: v1
kind: PersistentVolumeClaim
metadata:
  name: prometheus-data
  namespace: monitor
spec:
  selector:
    matchLabels:
      app: prometheus
  accessModes:
  - ReadWriteOnce
  resources:
    requests:
      storage: 20Gi
  storageClassName: local-storage
5.创建prometheus的rbac资源
由于 prometheus 可以访问 Kubernetes 的一些资源对象,所以需要配置 rbac 相关认证,这里我们使用了一个名为 prometheus 的 serviceAccount 对象:
[root@master1 p8s-example**]**#vim prometheus-rbac.yaml
# prometheus-rbac.yaml
apiVersion: v1
kind: ServiceAccount #创建一个ServiceAccount
metadata:
  name: prometheus
  namespace: monitor
---
apiVersion: rbac.authorization.k8s.io/v1
kind: ClusterRole
metadata:
  name: prometheus
rules:
- apiGroups:
  - ""
  resources:
  - nodes
  - services
  - endpoints
  - pods
  - nodes/proxy
  verbs:
  - get
  - list
  - watch
- apiGroups:
  - "extensions"
  resources:
    - ingresses
  verbs:
  - get
  - list
  - watch
- apiGroups:
  - ""
  resources:
  - configmaps
  - nodes/metrics
  verbs:
  - get
- nonResourceURLs:
  - /metrics
  verbs:
  - get
---
apiVersion: rbac.authorization.k8s.io/v1
kind: ClusterRoleBinding
metadata:
  name: prometheus
roleRef:
  apiGroup: rbac.authorization.k8s.io
  kind: ClusterRole
  name: prometheus
subjects:
- kind: ServiceAccount
  name: prometheus
  namespace: monitor
由于我们要获取的资源信息,在每一个 namespace 下面都有可能存在,所以我们这里使用的是 ClusterRole 的资源对象,值得一提的是我们这里的权限规则声明中有一个 nonResourceURLs 的属性,是用来对非资源型 metrics 进行操作的权限声明,这个在以前我们很少遇到过。
6.创建以上资源
- 创建prometheus.yml
我们这里暂时只配置了对 prometheus本身的监控,直接创建该资源对象:
[root@master1 p8s-example]#kubectl apply -f prometheus-cm.yaml
configmap/prometheus-config created
配置文件创建完成了,以后如果我们有新的资源需要被监控,我们只需要将上面的 ConfigMap 对象更新即可。
- 创建prometheus-pv-pvc.yaml
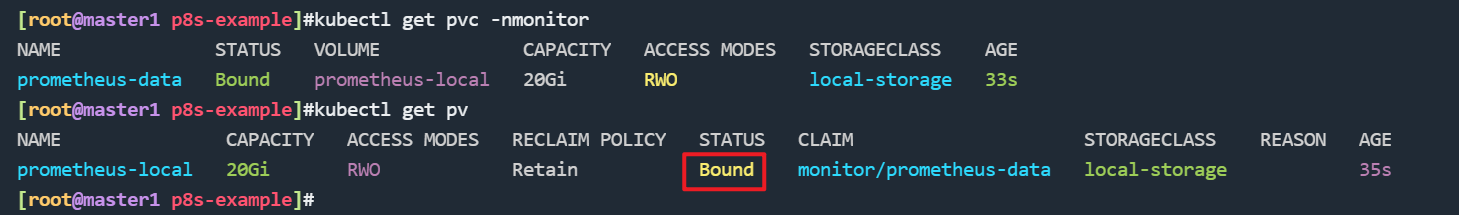
[root@master1 p8s-example]#kubectl apply -f prometheus-pvc.yaml
persistentvolume/prometheus-local created
persistentvolumeclaim/prometheus-data created

#验证
[root@master1 p8s-example]#kubectl get pvc -nmonitor
NAME              STATUS   VOLUME             CAPACITY   ACCESS MODES   STORAGECLASS    AGE
prometheus-data   Bound    prometheus-local   20Gi       RWO            local-storage   33s
[root@master1 p8s-example]#kubectl get pv
NAME               CAPACITY   ACCESS MODES   RECLAIM POLICY   STATUS   CLAIM                     STORAGECLASS    REASON   AGE
prometheus-local   20Gi       RWO            Retain           Bound    monitor/prometheus-data   local-storage            35s
- 创建prometheus-rbac.yaml
[root@master1 p8s-example]#kubectl apply -f prometheus-rbac.yaml
serviceaccount "prometheus" created
clusterrole.rbac.authorization.k8s.io "prometheus" created
clusterrolebinding.rbac.authorization.k8s.io "prometheus" created
- 现在我们就可以添加 promethues 的资源对象了:
[root@master1 p8s-example]#kubectl apply -f prometheus-deploy.yaml
deployment.apps/prometheus created

[root@master1 p8s-example]#kubectl get pods -n monitor
NAME                          READY   STATUS             RESTARTS      AGE
prometheus-58f59fd485-7hncv   0/1     CrashLoopBackOff   2 (24s ago)   112s

[root@master1 p8s-example]#kubectl logs  prometheus-58f59fd485-7hncv -nmonitor
ts=2022-04-29T04:42:09.982Z caller=main.go:516 level=info msg="Starting Prometheus" version="(version=2.34.0, branch=HEAD, revision=881111fec4332c33094a6fb2680c71fffc427275)"
ts=2022-04-29T04:42:09.982Z caller=main.go:521 level=info build_context="(go=go1.17.8, user=root@121ad7ea5487, date=20220315-15:18:00)"
ts=2022-04-29T04:42:09.982Z caller=main.go:522 level=info host_details="(Linux 3.10.0-957.el7.x86_64 #1 SMP Thu Nov 8 23:39:32 UTC 2018 x86_64 prometheus-58f59fd485-7hncv (none))"
ts=2022-04-29T04:42:09.982Z caller=main.go:523 level=info fd_limits="(soft=65536, hard=65536)"
ts=2022-04-29T04:42:09.982Z caller=main.go:524 level=info vm_limits="(soft=unlimited, hard=unlimited)"
ts=2022-04-29T04:42:09.983Z caller=query_logger.go:90 level=error component=activeQueryTracker msg="Error opening query log file" file=/prometheus/queries.active err="open /prometheus/queries.active: permission denied"
panic: Unable to create mmap-ed active query log

goroutine 1 [running]:
github.com/prometheus/prometheus/promql.NewActiveQueryTracker({0x7ffe09113e00, 0xb}, 0x14, {0x3637a40, 0xc0002032c0})
        /app/promql/query_logger.go:120 +0x3d7
main.main()
        /app/cmd/prometheus/main.go:569 +0x6049
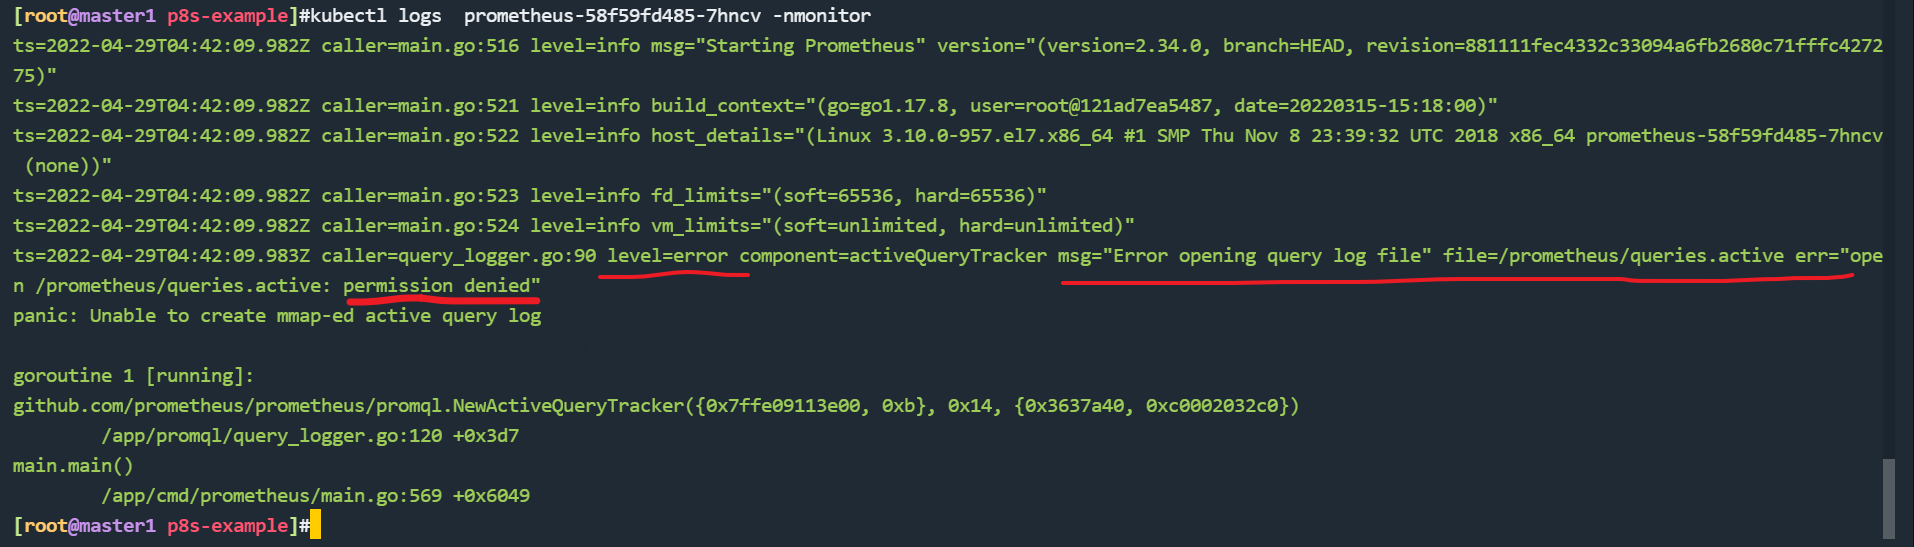
创建 Pod 后,我们可以看到并没有成功运行,出现了 open /prometheus/queries.active: permission denied 这样的错误信息,这是因为我们的 prometheus 的镜像中是使用的 nobody 这个用户,然后现在我们通过 LocalPV 挂载到宿主机上面的目录的 ownership 却是 root:
[root@node1 ~]#ls -la /data/k8s
total 0
drwxr-xr-x 3 root root 24 Apr 29 09:57 .
drwxr-xr-x 3 root root 17 Apr 29 09:57 ..
drwxr-xr-x 2 root root  6 Apr 29 09:57 prometheus
所以当然会出现操作权限问题了,这个时候我们就可以通过 securityContext 来为 Pod 设置下 volumes 的权限,通过设置 runAsUser=0 指定运行的用户为 root;也可以通过设置一个 initContainer 来修改数据目录权限(本次使用后面这种方法):
[root@master1 p8s-example]#vim prometheus-deploy.yaml
......
initContainers:
- name: fix-permissions
  image: busybox
  command: [chown, -R, "nobody:nobody", /prometheus]
  volumeMounts:
  - name: data
    mountPath: /prometheus
- 这个时候我们重新更新下 prometheus:
[root@master1 p8s-example]#kubectl apply -f prometheus-deploy.yaml
deployment.apps/prometheus configured

[root@master1 p8s-example]#kubectl get pods -n monitor
NAME                          READY   STATUS    RESTARTS   AGE
prometheus-849c8456c7-dz6rt   1/1     Running   0          54s


[root@master1 p8s-example]#kubectl logs prometheus-849c8456c7-dz6rt  -nmonitor
……
ts=2022-04-29T05:00:09.184Z caller=main.go:1142 level=info msg="Loading configuration file" filename=/etc/prometheus/prometheus.yml
ts=2022-04-29T05:00:09.185Z caller=main.go:1179 level=info msg="Completed loading of configuration file" filename=/etc/prometheus/prometheus.yml totalDuration=1.128855ms db_storage=1.302µs remote_storage=5.18µs web_handler=721ns query_engine=2.705µs scrape=773.91µs scrape_sd=66.725µs notify=1.443µs notify_sd=2.966µs rules=4.859µs tracing=20.118µs
ts=2022-04-29T05:00:09.185Z caller=main.go:910 level=info msg="Server is ready to receive web requests."

7.创建prometheus的svc资源
- Pod 创建成功后,为了能够在外部访问到 prometheus 的 webui 服务,我们还需要创建一个 Service 对象:
[root@master1 p8s-example]#vim prometheus-svc.yaml
# prometheus-svc.yaml
apiVersion: v1
kind: Service
metadata:
  name: prometheus
  namespace: monitor
  labels:
    app: prometheus
spec:
  selector:
    app: prometheus
  type: NodePort
  ports:
    - name: web
      port: 9090
      targetPort: http
- 为了方便测试,我们这里创建一个
NodePort类型的服务,当然我们可以创建一个Ingress对象,通过域名来进行访问:
[root@master1 p8s-example]#kubectl apply -f prometheus-svc.yaml
service/prometheus created

[root@master1 p8s-example]#kubectl get svc -nmonitor
NAME         TYPE       CLUSTER-IP     EXTERNAL-IP   PORT(S)          AGE
prometheus   NodePort   10.108.47.93   <none>        9090:30092/TCP   9s
8.测试
- 现在我们就可以通过
http://任意节点IP:30980访问 prometheus 的 webui 服务了:
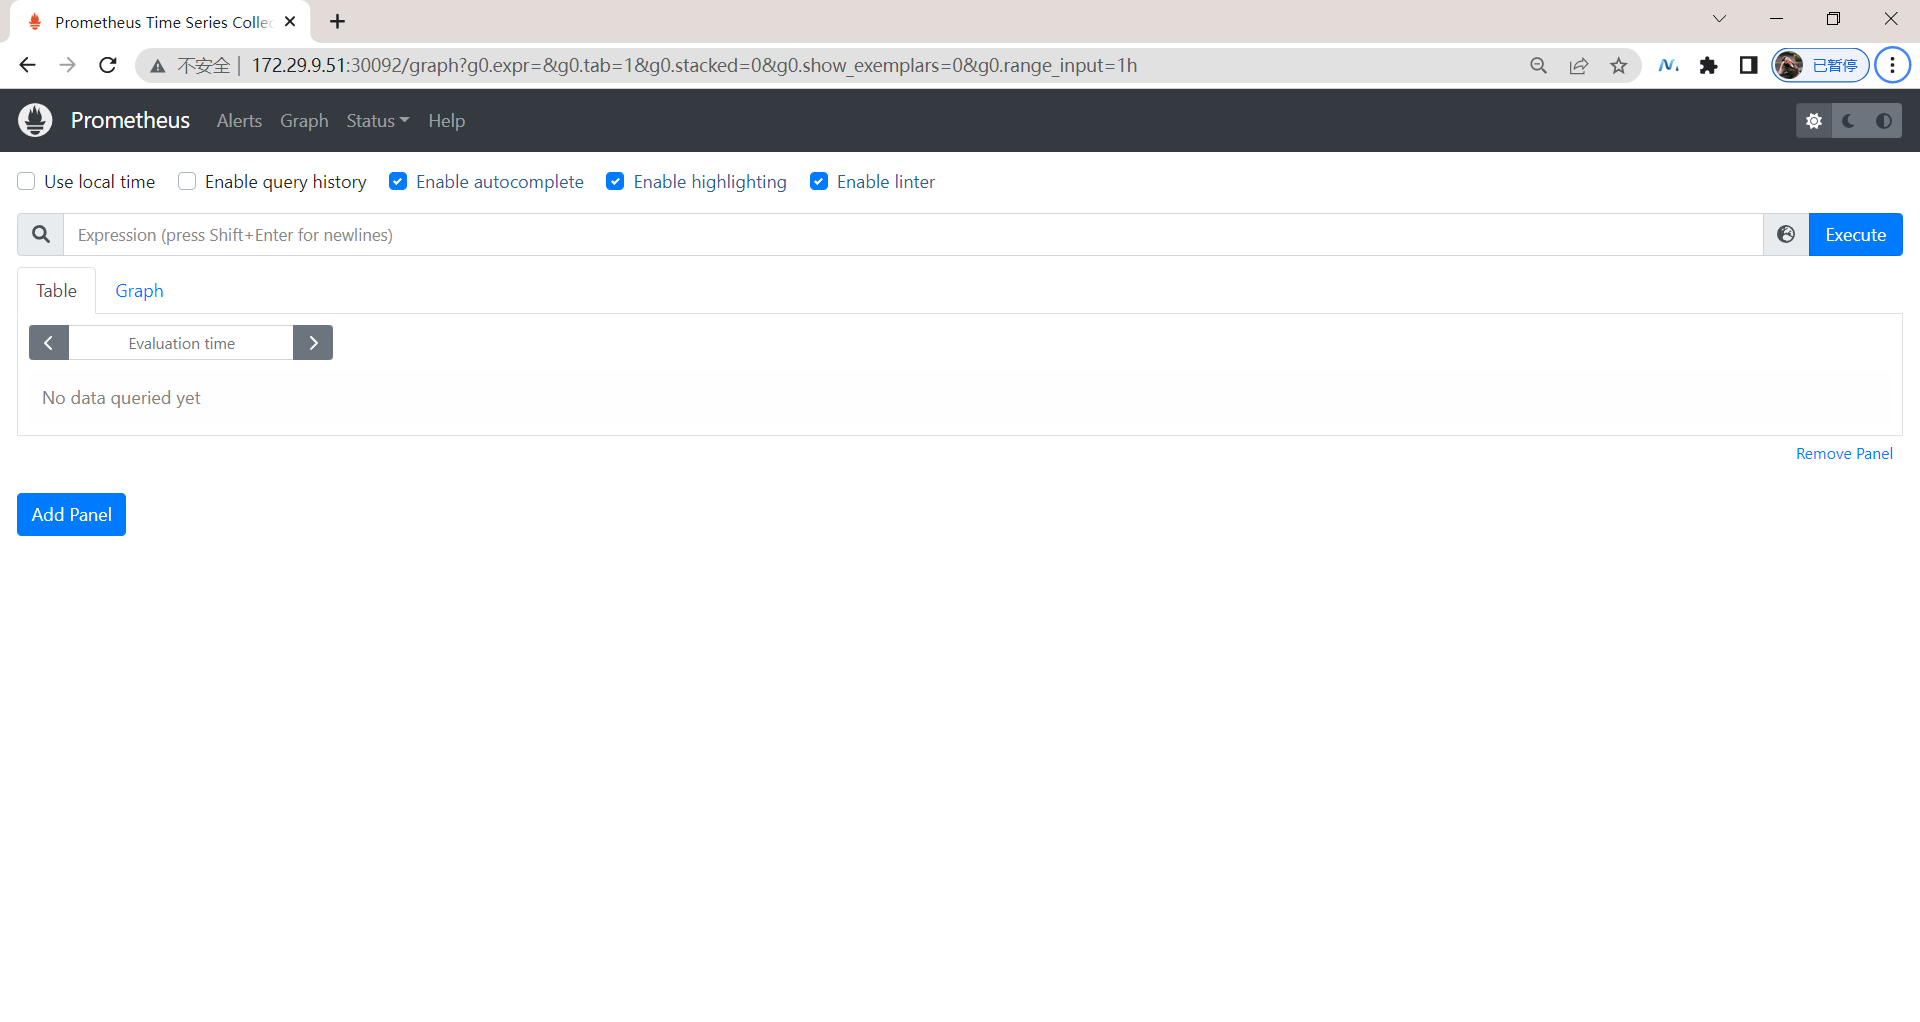
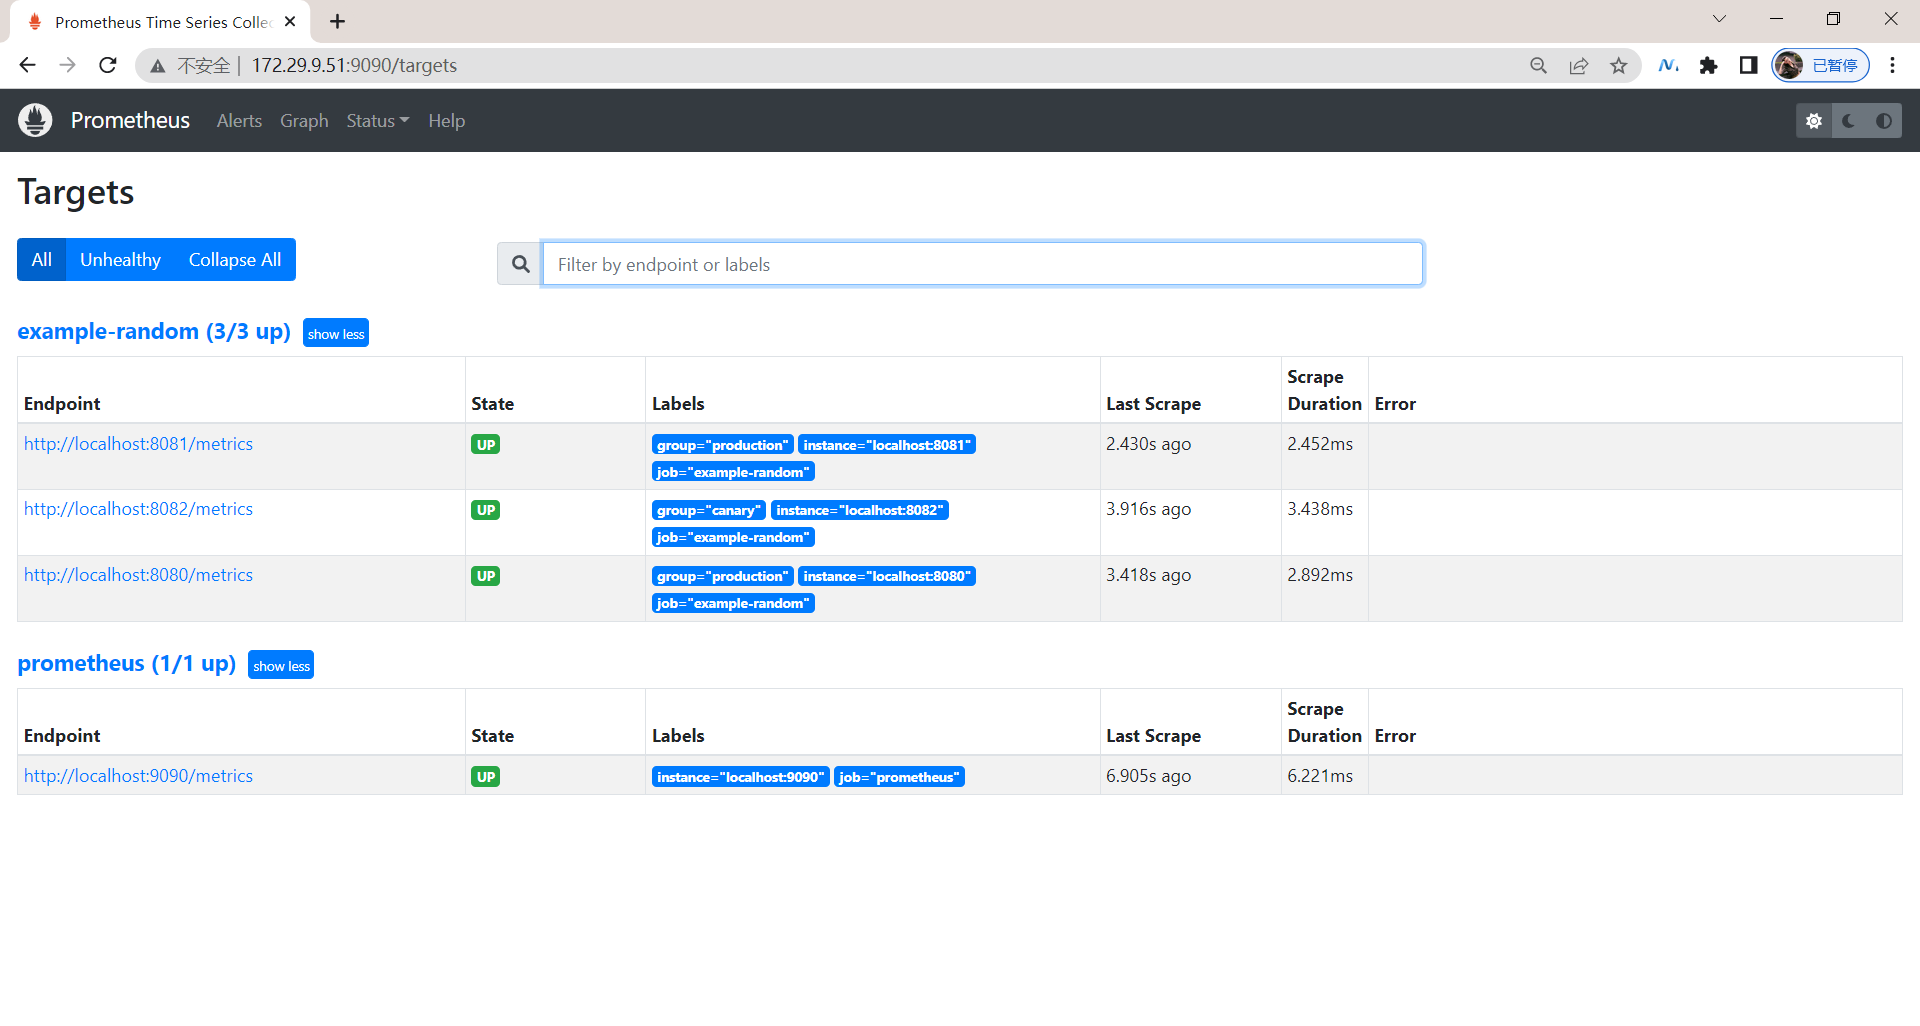
- 现在我们可以查看当前监控系统中的一些监控目标(Status -> Targets):
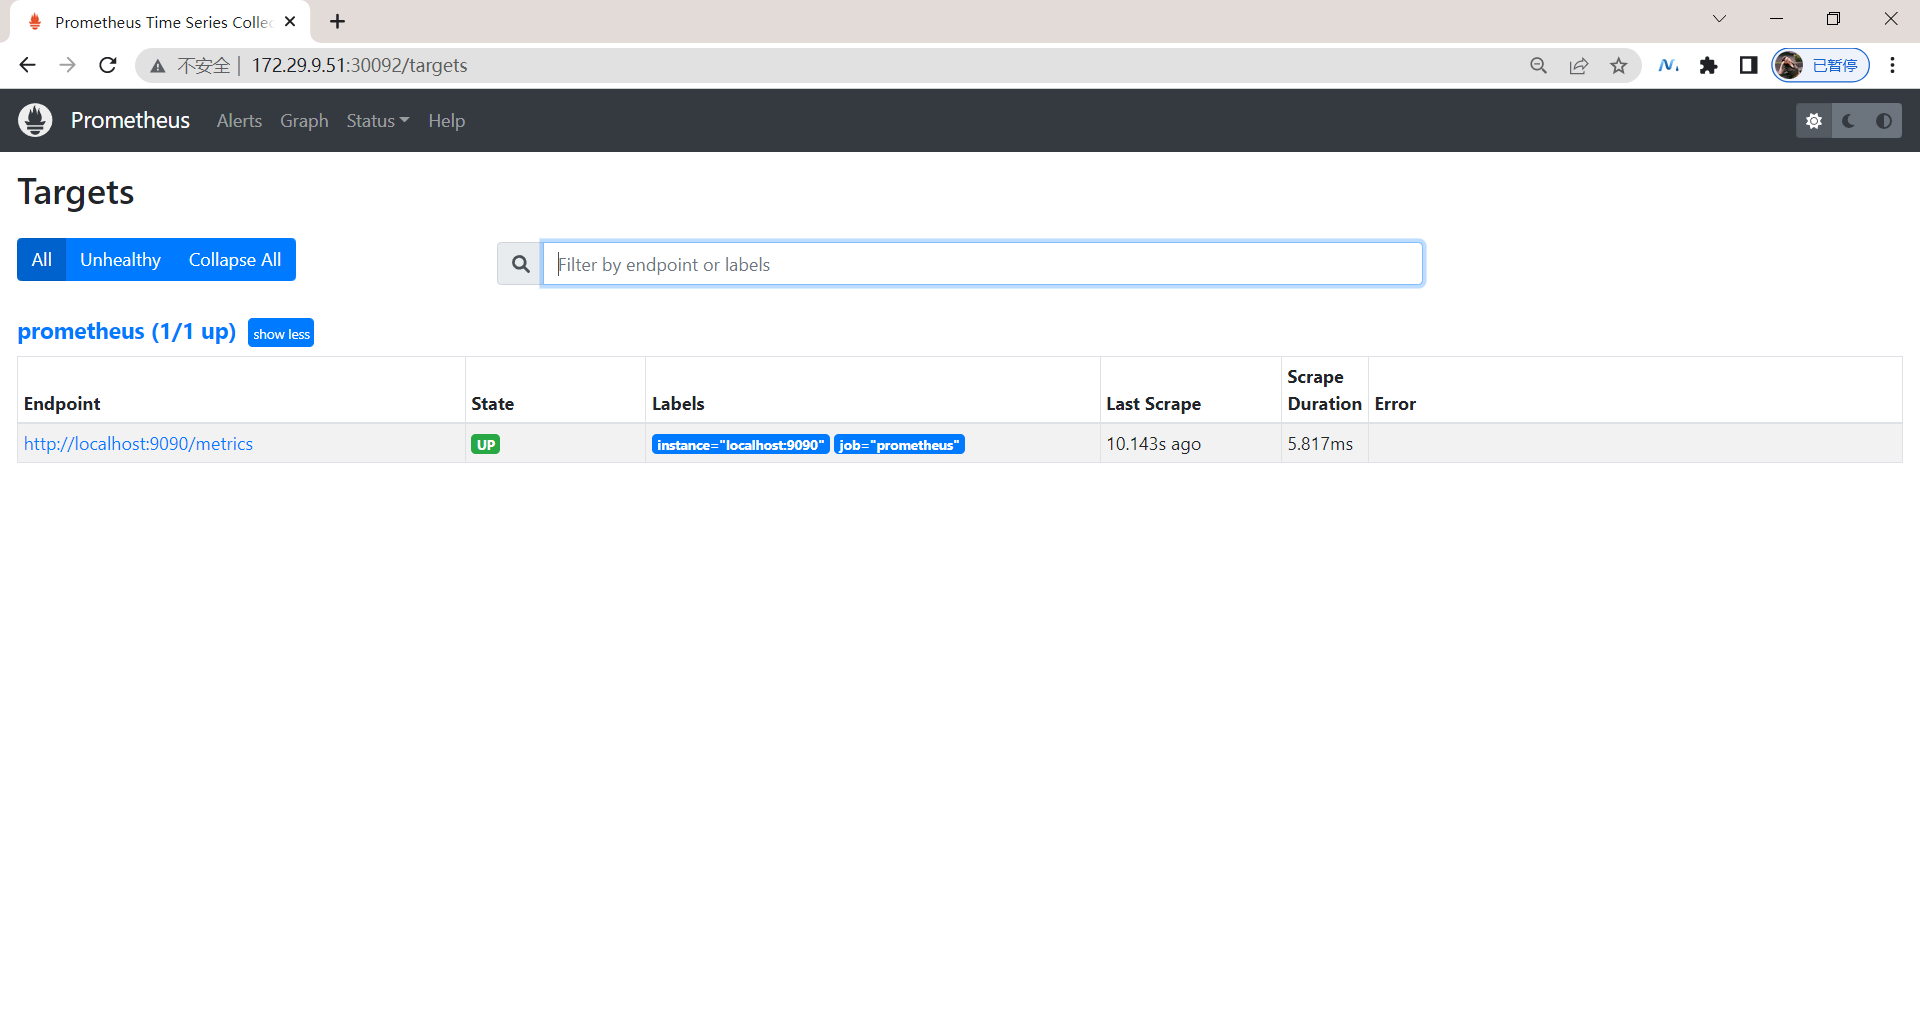
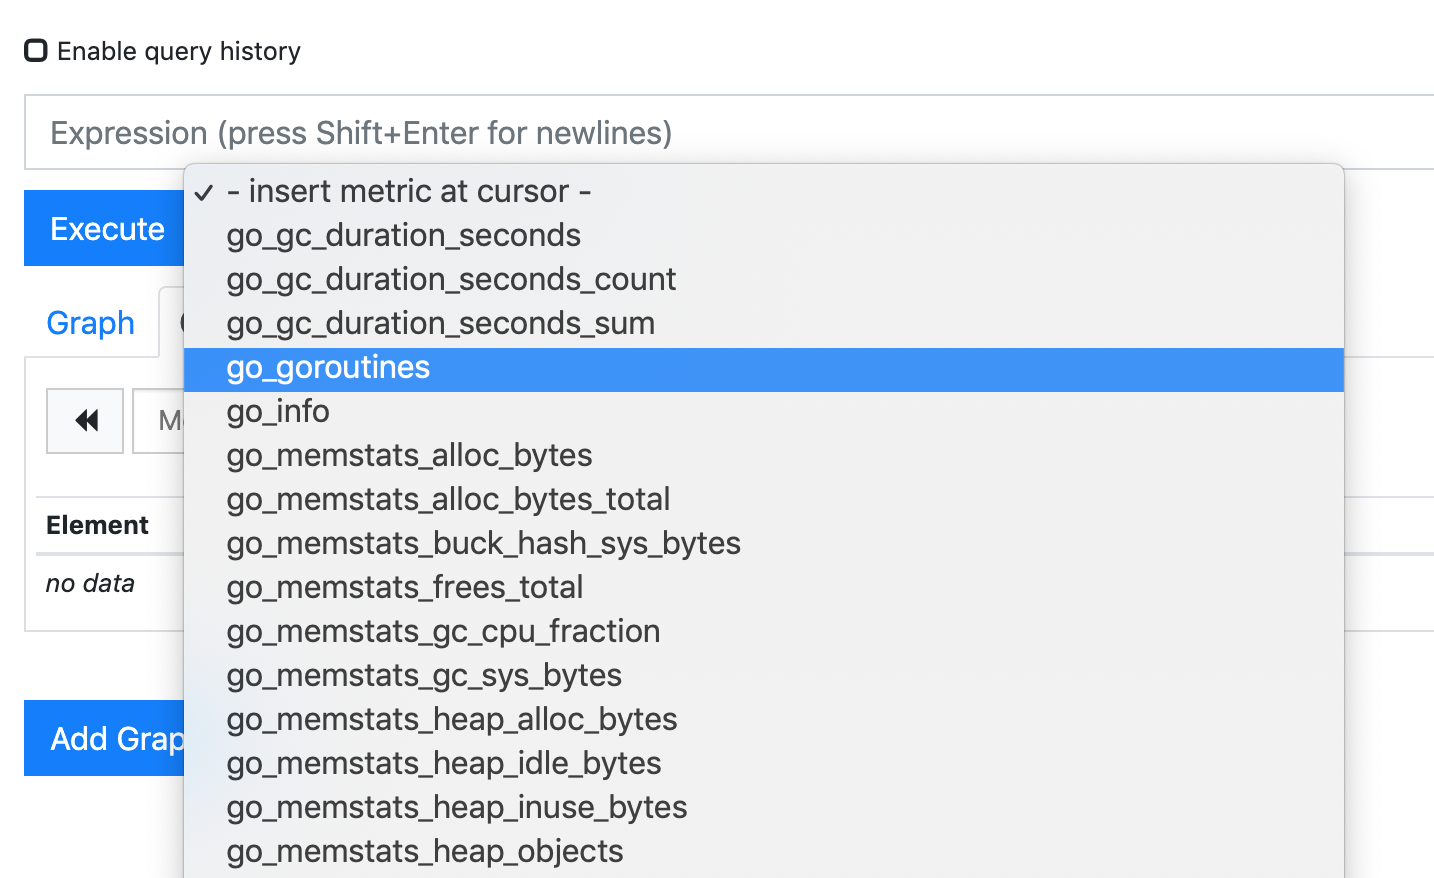
由于我们现在还没有配置任何的报警信息,所以 Alerts 菜单下面现在没有任何数据,隔一会儿,我们可以去 Graph 菜单下面查看我们抓取的 prometheus 本身的一些监控数据了,其中 - insert metrics at cursor -下面就有我们搜集到的一些监控指标数据:
- 比如我们这里就选择
scrape_duration_seconds这个指标,然后点击Execute,就可以看到类似于下面的图表数据了:
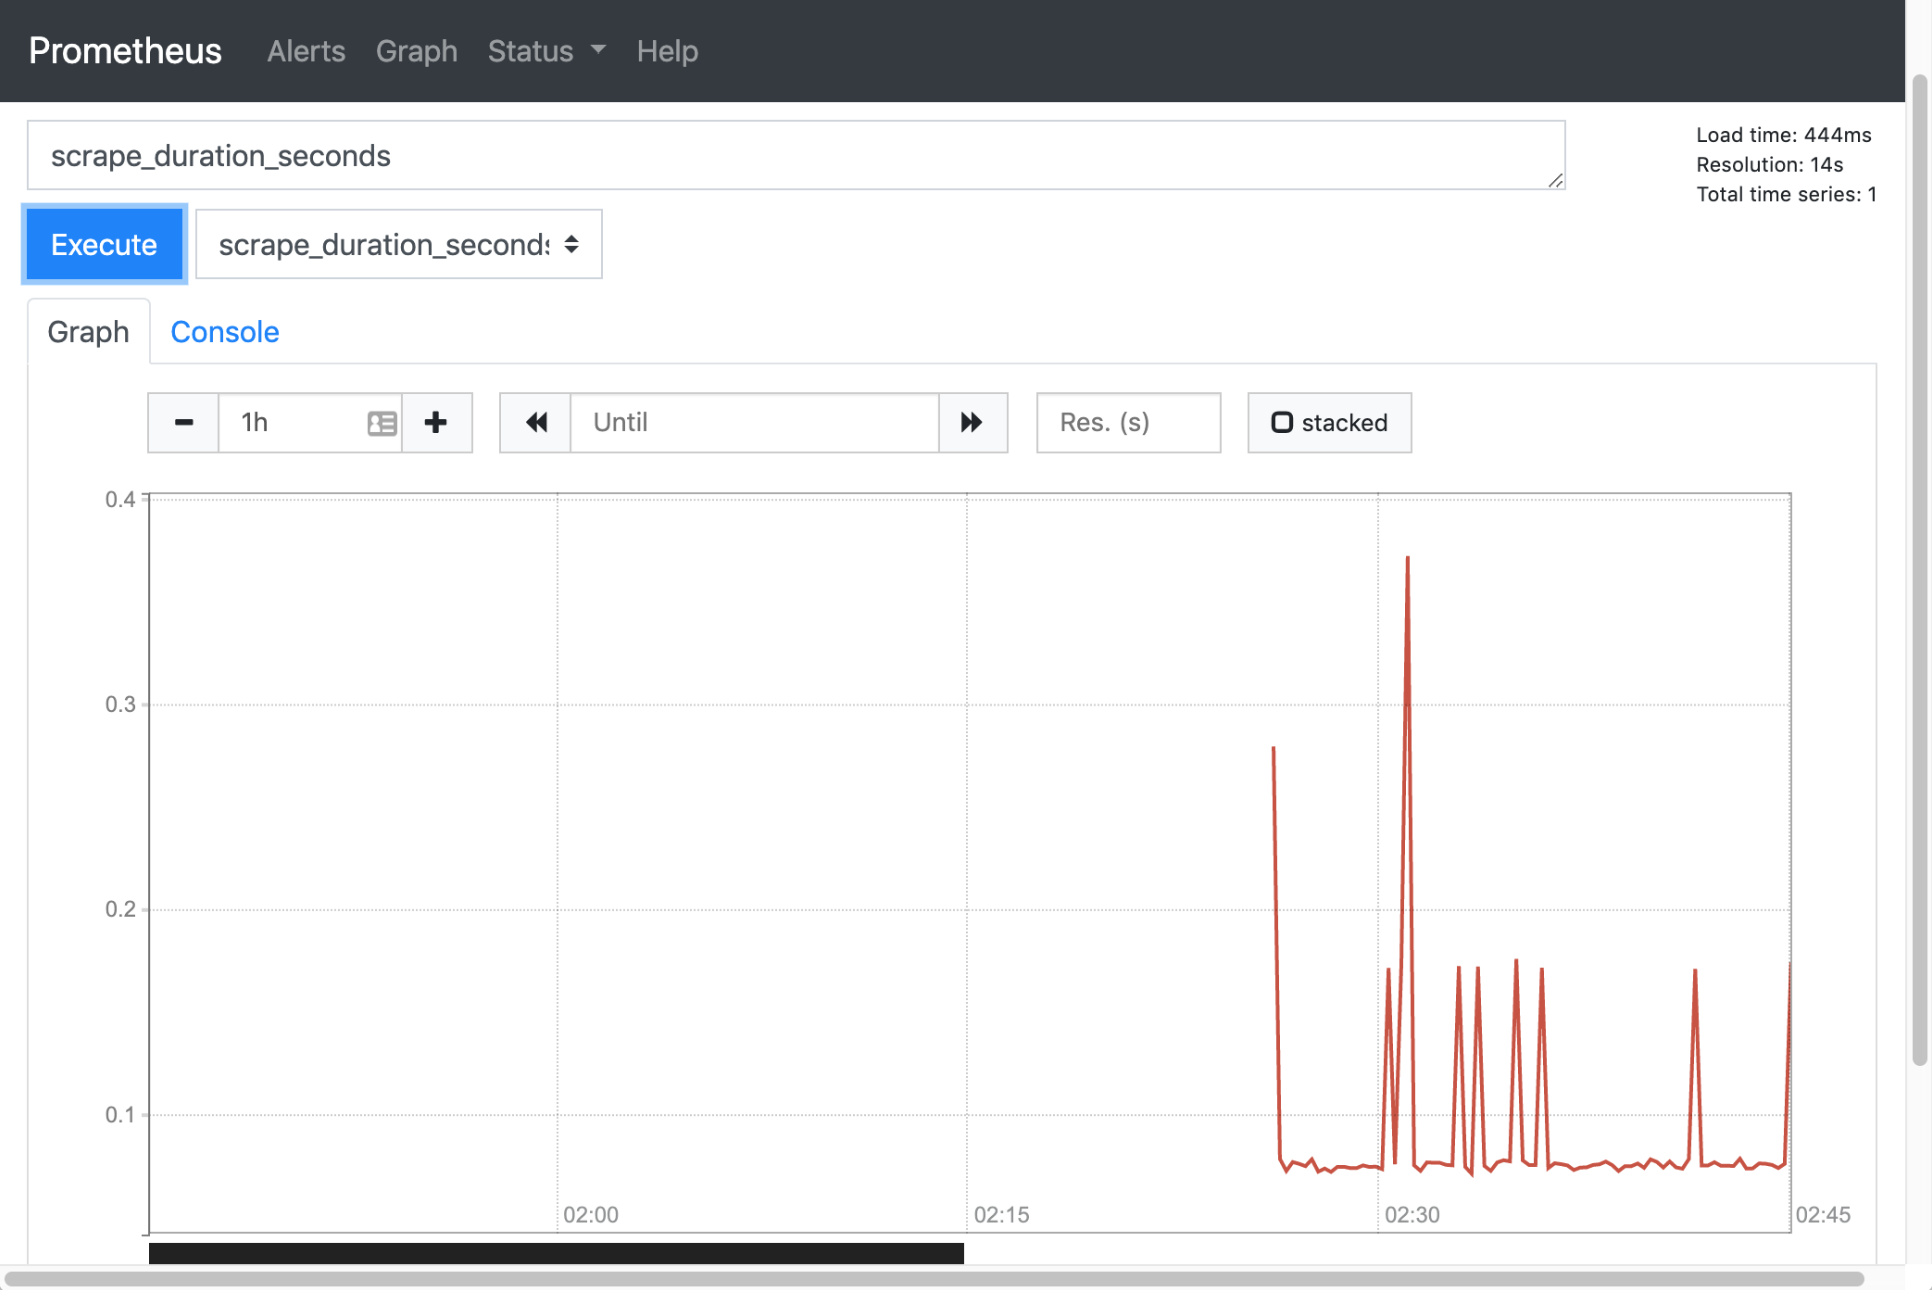
测试结束。😘
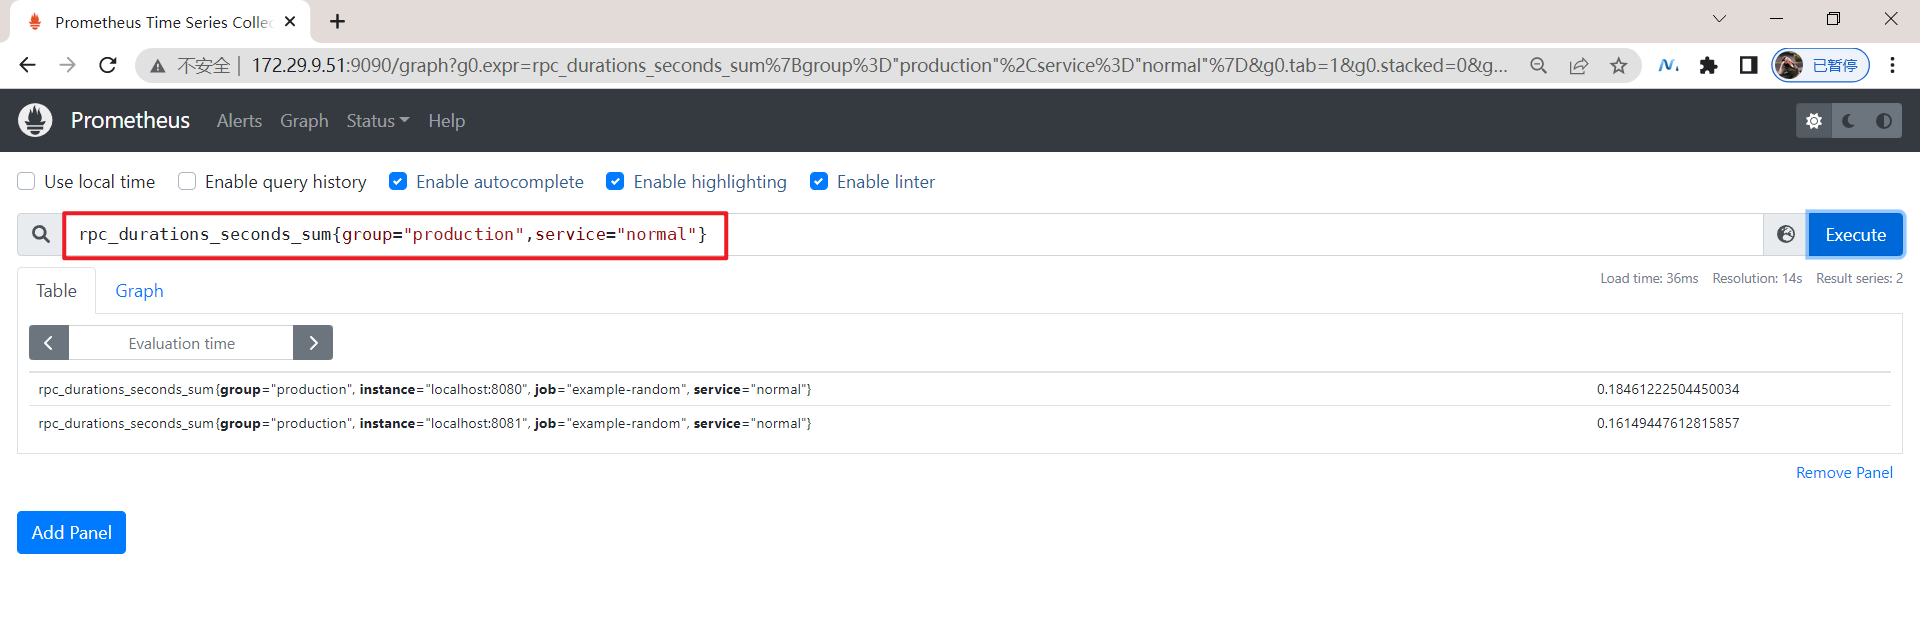
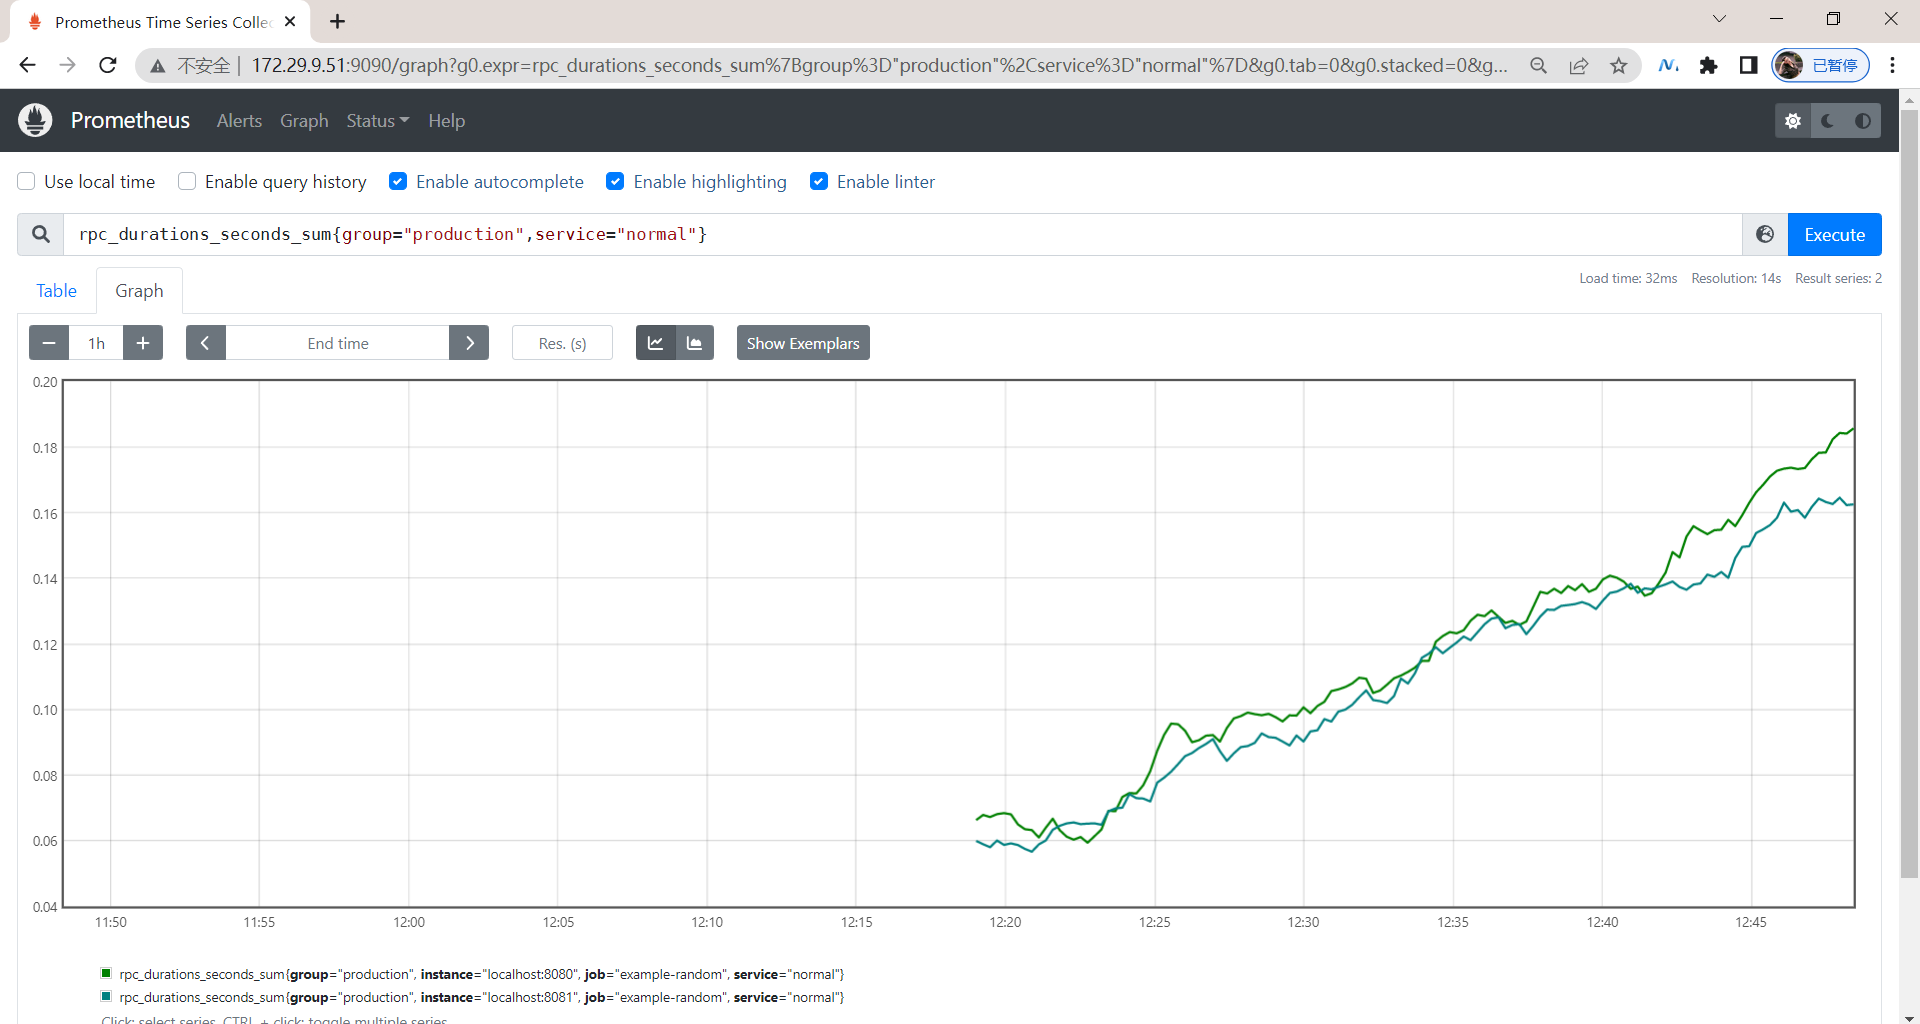
除了简单的直接使用采集到的一些监控指标数据之外,这个时候也可以使用强大的 PromQL 工具,PromQL 其实就是 prometheus 便于数据聚合展示开发的一套 adhoc 查询语言的,你想要查什么找对应函数取你的数据好了。
关于我
我的博客主旨:我希望每一个人拿着我的博客都可以做出实验现象,先把实验做出来,然后再结合理论知识更深层次去理解技术点,这样学习起来才有乐趣和动力。并且,我的博客内容步骤是很完整的,也分享源码和实验用到的软件,希望能和大家一起共同进步!
各位小伙伴在实际操作过程中如有什么疑问,可随时联系本人免费帮您解决问题:
-
个人微信二维码:x2675263825 (舍得), qq:2675263825。

-
个人微信公众号:《云原生架构师实战》

-
个人csdn
https://blog.csdn.net/weixin_39246554?spm=1010.2135.3001.5421
-
个人已开源干货😘
不服来怼:宇宙中最好用的云笔记 & 其他开源干货:https://www.yuque.com/go/doc/73723298?#

-
知乎
https://www.zhihu.com/people/foryouone

-
个人博客
https://www.onlyonexl.cn/
-
个人网站:(计划ing)
最后
好了,关于prometheus安装实验就到这里了,感谢大家阅读,最后祝大家生活快乐,每天都过的有意义哦,我们下期

K8S/Kubernetes社区为您提供最前沿的新闻资讯和知识内容
更多推荐


 2
2 0
0- 0


 已为社区贡献76条内容

所有评论(0)