
计算机图形学:二次和三次贝塞尔曲线(通过Pymatplotlib绘制)
在计算机中,直接拖动去绘制曲线很难获得想要的图形,法国工程师发表了贝塞尔曲线的概念,贝塞尔曲线是计算机图形图像造型的基本工具,是图形造型运用得最多的基本线条之一二次贝塞尔曲线下面的链接可以直观的,拖动第三点即可感受到贝塞尔曲线的“圆滑”贝塞尔曲线绘制:贝塞尔曲线在线绘制🚀...
·
在计算机中,直接拖动去绘制曲线很难获得想要的图形,法国工程师发表了贝塞尔曲线的概念,贝塞尔曲线是计算机图形图像造型的基本工具,是图形造型运用得最多的基本线条之一
二次贝塞尔曲线
下面的链接可以直观的,拖动第三点即可感受到贝塞尔曲线的“圆滑”
贝塞尔曲线绘制:贝塞尔曲线在线绘制🚀

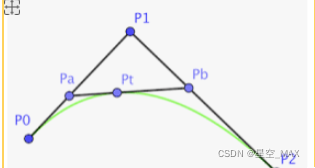
在如下图形中:
P1Pa:PaP0=P2Pb:PbP1=PbPt:PtPa=t
Pt的运动绘制出曲线
运动公式为
![]()
在Python中的实现方式,注意得先下载matplotlib库
from matplotlib import pyplot  #导入pyplot库
import numpy as np  #导入numpy库
points = [
    [0,0],
    [1,0],
    [1,1],
    [2,1]
]

points = np.array(points) #把列表转换为数组


# 通过递归构造贝塞尔曲线
def calNextPoints(points, rate): # 如果给定了具体的n, 那么可以直接得到计算方程
    if len(points) == 1:
        return points  #若最后一个点,返回

    left = points[0]
    ans = []
    for i in range(1, len(points)): # 根据比例计算当前的点的坐标,一层层的推进
        right = points[i]
        disX = right[0] - left[0]
        disY = right[1] - left[1]

        nowX = left[0] + disX * rate
        nowY = left[1] + disY * rate
        ans.append([nowX, nowY])  #将nowX和nowY填入ans数组中


        left = right #更新left

    return calNextPoints(ans, rate) #继续递归

X = []
Y = []
for r in range(1, 100):    #循环次数越多,画出的图形越平滑
    r = r / 100
    a = calNextPoints(points, rate=r)  #计算位置
    x = a[0][0]
    y = a[0][1]
    X.append(x)
    Y.append(y)


print(points[:,1])
pyplot.scatter(points[:,0], points[:,1], c='red') #画出散点位置
pyplot.plot(X, Y) #根据点集画出曲线

pyplot.show()
画出后的效果如下:

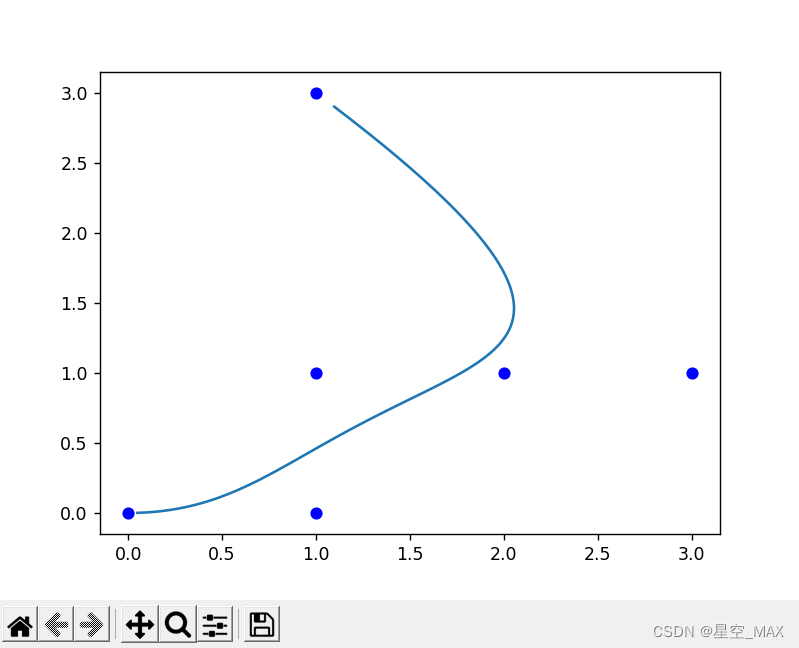
三次贝塞尔曲线
三次曲线是拿三条直线取相同比例的点连接而成,再在形成的双线基础上面取对应比例的点,再在最后形成的线上面取对应比例的点运动而形成
三次贝塞斯曲线绘制过程如下图:

曲线运动公式如下图:

from matplotlib import pyplot
import numpy as np
points = [
    [0,0],
    [1,0],
    [1,1],
    [2,1],
    [3,1],
    [1,3],
]

points = np.array(points)


# 通过递归构造贝塞尔曲线
def calNextPoints(points, rate): # 如果给定了具体的n, 那么可以直接得到计算方程
    if len(points) == 1:
        return points

    left = points[0]
    ans = []
    for i in range(1, len(points)): # 根据比例计算当前的点的坐标,一层层的推进
        right = points[i]
        disX = right[0] - left[0]
        disY = right[1] - left[1]

        nowX = left[0] + disX * rate
        nowY = left[1] + disY * rate
        ans.append([nowX, nowY])

        # 更新left
        left = right

    return calNextPoints(ans, rate)

X= []
Y = []
for r in range(1, 100):
    r = r / 100
    a = calNextPoints(points, rate=r)
    # print(a)
    x = a[0][0]
    y = a[0][1]
    X.append(x)
    Y.append(y)


print(points[:,1])
pyplot.scatter(points[:,0], points[:,1], c='blue')
pyplot.plot(X, Y)

pyplot.show()
画出后效果如下:

鸿蒙生态一站式服务平台。
更多推荐

 1
1 0
0- 0


 已为社区贡献1条内容

所有评论(0)