vue中的曲线图
vue的曲线图echart网址:https://echarts.apache.org/examples/zh/editor.html?c=line-smooth1…在vue项目中先引用:import * as echarts from 'echarts’2…在html部分: 如果把曲线图放在一个弹窗里面:3…在data()中先定义://曲线图waterInfoListData:null,optio
vue的曲线图
- echart网址:
https://echarts.apache.org/examples/zh/editor.html?c=line-smooth
1…在vue项目中先引用:
import * as echarts from 'echarts’
2…在html部分: 如果把曲线图放在一个弹窗里面:

3…在data()中先定义:
//曲线图
waterInfoListData:null,
option: {
title: {
text: ‘尾水流量信息’
},
tooltip: {
trigger: ‘axis’,
show: true
},
//氨氮、总氮、总磷、COD、PH、浊度
legend: {
left:‘25%’,
top:‘1%’,
data: [‘日累计流量’,‘月度累计流量’, ‘年度累计流量’] //这个必须要跟series一样
},
grid: {
left: ‘5%’,//图位置
right: ‘3%’,
bottom: ‘3%’,
containLabel: true
},
toolbox: {
feature: {
saveAsImage: {}
}
},
xAxis: {
type: ‘category’, //不需要改
boundaryGap: false,
data: [‘0’, ‘0’, ‘0’, ‘0’, ‘0’, ‘0’, ‘0’],//想要初始化6组数
axisTick: {
show: false
},
           },
            yAxis: {
              type: 'value'
            },

            series: [
               {
                name: '日累计流量',
                type: 'line',
                stack: 'Total',
                 data: [0, 0, 0, 0, 0, 0, 0],
                   itemStyle: {
                        normal: {
                          color: "#ef6161",//折线点的颜色
                              lineStyle: {
                                  color: "#ef6161"//折线的颜色
                                }
                          }
                        },
                    },
             {
                name: '月度累计流量',
                type: 'line',
                stack: 'Total',
                data: [0, 0, 0, 0, 0, 0, 0]
              },
              {
                name: '年度累计流量',
                type: 'line',
                stack: 'Total',
                  data: [0, 0, 0, 0, 0, 0, 0]
                }
4…在方法里:
//曲线图
drawLineChart() {
//获取数据
const data={
‘facilityId’:this.temp.facilityId,
‘companyId’:this.temp.companyId,
}
selectTailFluxListT(data).then(res => {
this.waterInfoListData=res.data.data
})
},
  drawLine(){
     //将json对象的所有id数据组成一个数组,
     var data=this.waterInfoListData;
    this.option.xAxis.data=[]; //横轴。
         this.option.series[0].data=[]; //必须要先初始化,要不然一打开就多一个数据
         this.option.series[1].data=[]; //氧气值
      this.option.series[2].data=[];

      for(let i = 0;i < data.length;i++){
            this.option.xAxis.data.push(data[i].createDate);//横轴。
         this.option.series[0].data.push(data[i].todayFlux)
         this.option.series[1].data.push(data[i].monthFlux); //氧气值
      this.option.series[2].data.push(data[i].yearFlux);
}
var chartDom = document.getElementById(‘myChart’);
var myChart = echarts.init(chartDom);
myChart.setOption(this.option);
},
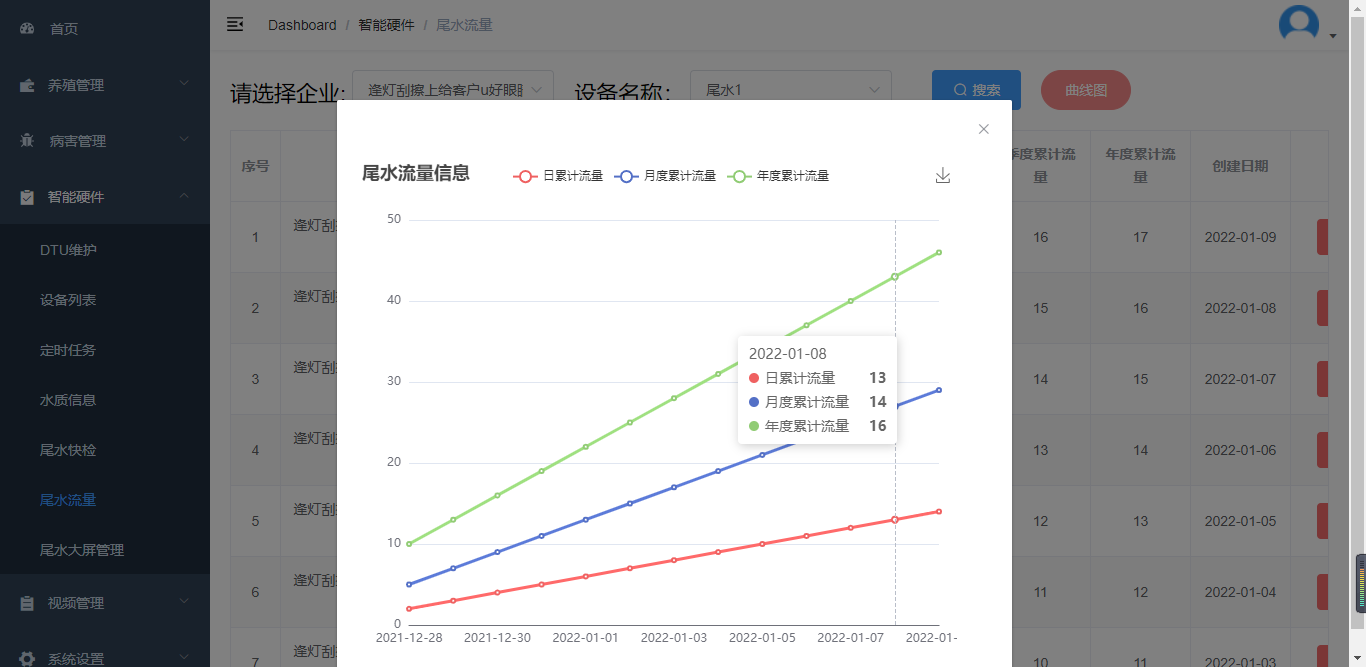
成图:


前往低代码交流专区
更多推荐

 2
2 0
0- 0


 已为社区贡献1条内容

所有评论(0)