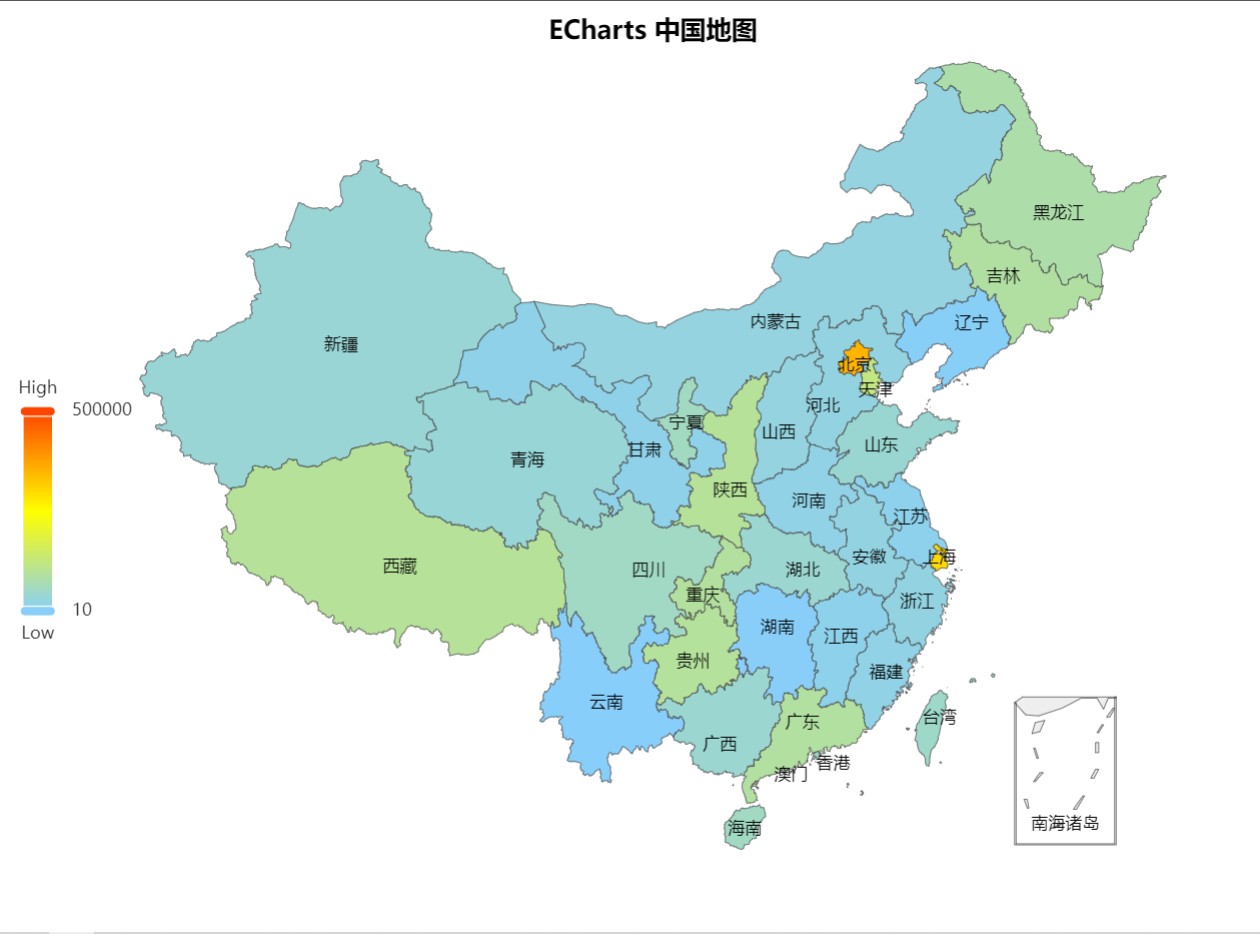
Echarts使用 (带有中国地图的使用)
vue 中 使用 echarts (中国地图实例)
·
vue 项目的使用方式
Echarts 的官网
https://echarts.apache.org/
在 vue 项目中使用需要使用命令安装相关的配置
npm install echarts --save
不建议全部引入,会导致项目的体积变得太大
下面是按需引入的方式
<template>
  <div id="app">
    <!-- 显示 echarts 的容器 -->
    <div style="width: 300px; height: 300px" ref="echarts-container"></div>
  </div>
</template>
在获取要显示 Echarts 的容器时,没有采用 getElementBy... 的方式,而是直接使用 ref 的方式
<script>
import * as echarts from 'echarts/core';
import {
  ...
} from 'echarts/components';
import { ... } from 'echarts/charts';
echarts.use([
  ...
]);
export default {
  name: "app",
  data: function () {
    return {
      // 以后要修改表格,直接修改 options 里的参数就可以
      options: {}
    }
  },
  methods: {
    createEcharts() {
      // 基于准备好的dom,初始化echarts实例
      let myChart = echarts.init(this.$refs["echarts-container"]);
      myChart.setOption(this.options);
    }
  },
  mounted () {
    this.createEcharts()
  }
}
</script>
在挂载以后 , 我们可以直接修改参数来改变想要得到的图表
使用演示
打开 Echarts 官网

点击快速入门

然后选择喜欢的样式

将代码复制粘贴,就可以直接使用了
vue 项目的使用案例
一个饼图
<template>
  <div id="app">
    <!-- 显示 echarts 的容器 -->
    <div style="width: 600px; height: 600px" ref="echarts-container"></div>
  </div>
</template>

<script>
import * as echarts from 'echarts/core';
import {
  TitleComponent,
  TooltipComponent,
  LegendComponent
} from 'echarts/components';
import { PieChart } from 'echarts/charts';
import { LabelLayout } from 'echarts/features';
import { CanvasRenderer } from 'echarts/renderers';
echarts.use([
  TitleComponent,
  TooltipComponent,
  LegendComponent,
  PieChart,
  CanvasRenderer,
  LabelLayout
]);
export default {
  name: "app",
  data: function () {
    return {
      // 以后要修改表格,直接修改 options 里的参数就可以
      options: {
        title: {
          text: '课程: 大数据导论',
          subtext: '大数据与软件工程的结合',
          left: 'center'
        },
        tooltip: {
          trigger: 'item'
        },
        legend: {
          orient: 'vertical',
          left: 'left'
        },
        series: [
          {
            name: 'Access From',
            type: 'pie',
            radius: '50%',
            data: [
              { value: 1, name: '大一学生' },
              { value: 30, name: '大二学生' },
              { value: 2, name: '大三学生' },
              { value: 1, name: '大四学生' },
              { value: 1, name: '老师' }
            ],
            emphasis: {
              itemStyle: {
                shadowBlur: 10,
                shadowOffsetX: 0,
                shadowColor: 'rgba(0, 0, 0, 0.5)'
              }
            }
          }
        ]
      }
    }
  },
  methods: {
    createEcharts() {
      // 基于准备好的dom,初始化echarts实例
      let myChart = echarts.init(this.$refs["echarts-container"]);
      myChart.setOption(this.options);
    }
  },
  mounted () {
    this.createEcharts()
  }
}
</script>

最后只需要修改 this.options.series.data 中的数据就可以修改要展示的视图
折线图
<template>
  <div id="app">
    <!-- 显示 echarts 的容器 -->
    <div style="width: 600px; height: 600px" ref="echarts-container"></div>
  </div>
</template>

<script>
import * as echarts from 'echarts/core';
import {
  TitleComponent,
  TooltipComponent,
  LegendComponent
} from 'echarts/components';
import { PieChart } from 'echarts/charts';
import { LabelLayout } from 'echarts/features';
import { CanvasRenderer } from 'echarts/renderers';
echarts.use([
  TitleComponent,
  TooltipComponent,
  LegendComponent,
  PieChart,
  CanvasRenderer,
  LabelLayout
]);
export default {
  name: "app",
  data: function () {
    return {
      // 以后要修改表格,直接修改 options 里的参数就可以
      options: {
        xAxis: {
          type: 'category',
          data: ['一', '二', '三', '四', '五', '六', '日']
        },
        yAxis: {
          type: 'value'
        },
        series: [
          {
            data: [1, 2, 33, 4, 10, 30, 1],
            type: 'line',
            smooth: true
          }
        ]
      }
    }
  },
  methods: {
    createEcharts() {
      // 基于准备好的dom,初始化echarts实例
      let myChart = echarts.init(this.$refs["echarts-container"]);
      myChart.setOption(this.options);
    }
  },
  mounted () {
    this.createEcharts()
  }
}
</script>

柱状图
<template>
  <div id="app">
    <!-- 显示 echarts 的容器 -->
    <div style="width: 600px; height: 600px" ref="echarts-container"></div>
  </div>
</template>

<script>
import * as echarts from 'echarts/core';
import {
  TitleComponent,
  TooltipComponent,
  LegendComponent
} from 'echarts/components';
import { PieChart } from 'echarts/charts';
import { LabelLayout } from 'echarts/features';
import { CanvasRenderer } from 'echarts/renderers';
echarts.use([
  TitleComponent,
  TooltipComponent,
  LegendComponent,
  PieChart,
  CanvasRenderer,
  LabelLayout
]);
export default {
  name: "app",
  data: function () {
    return {
      // 以后要修改表格,直接修改 options 里的参数就可以
      options: {
        xAxis: {
          type: 'category',
          data: ['Mon', 'Tue', 'Wed', 'Thu', 'Fri', 'Sat', 'Sun']
        },
        yAxis: {
          type: 'value'
        },
        series: [
          {
            data: [120, 200, 150, 80, 70, 110, 130],
            type: 'bar'
          }
        ]
      }
    }
  },
  methods: {
    createEcharts() {
      // 基于准备好的dom,初始化echarts实例
      let myChart = echarts.init(this.$refs["echarts-container"]);
      myChart.setOption(this.options);
    }
  },
  mounted () {
    this.createEcharts()
  }
}
</script>

中国地图
import "@/utils/china"
这里的需要单独下载,最近官方找不到了
<template>
  <div class="echarts-map-china" ref="echarts-map-china"></div>
</template>

<script>
import "@/utils/china"
import * as echarts from 'echarts';

export default {
  data() {
    return {
      options: {
        //标题样式
        title: {
          text: 'ECharts 中国地图',
          x: "center",
          textStyle: {
            fontSize: 18,
            color: "black"
          },
        },
        //这里设置提示框 (鼠标悬浮效果)
        tooltip: {
          //数据项图形触发
          trigger: 'item',
          //提示框浮层的背景颜色。 (鼠标悬浮后的提示框背景颜色)
          backgroundColor: "white",
          //字符串模板(地图): {a}(系列名称),{b}(区域名称),{c}(合并数值),{d}(无)
          formatter: '地区:{b}<br/>模拟数据:{c}'
        },
        //视觉映射组件
        visualMap: {
          top: 'center',
          left: 'left',
          // 数据的范围
          min: 10,
          max: 500000,
          text: ['High', 'Low'],
          realtime: true,  //拖拽时,是否实时更新
          calculable: true,  //是否显示拖拽用的手柄
          inRange: {
            // 颜色分布
            color: ['lightskyblue', 'yellow', 'orangered']
          }
        },
        series: [
          {
            name: '模拟数据',
            type: 'map',
            mapType: 'china',
            roam: true,
            //是否开启鼠标缩放和平移漫游
            itemStyle: {
              //地图区域的多边形 图形样式
              normal: {
                //是图形在默认状态下的样式
                label: {
                  show: true,//是否显示标签
                  textStyle: {
                    color: "black"
                  }
                }
              },
              zoom: 1.5,
              //地图缩放比例,默认为1
              emphasis: {
                //是图形在高亮状态下的样式,比如在鼠标悬浮或者图例联动高亮时
                label: {show: true}
              }
            },
            top: "5%",//组件距离容器的距离
            data: [
              {name: '北京', value: 350000},
              {name: '天津', value: 120000},
              {name: '上海', value: 300000},
              {name: '重庆', value: 92000},
              {name: '河北', value: 25000},
              {name: '河南', value: 20000},
              {name: '云南', value: 500},
              {name: '辽宁', value: 3050},
              {name: '黑龙江', value: 80000},
              {name: '湖南', value: 2000},
              {name: '安徽', value: 24580},
              {name: '山东', value: 40629},
              {name: '新疆', value: 36981},
              {name: '江苏', value: 13569},
              {name: '浙江', value: 24956},
              {name: '江西', value: 15194},
              {name: '湖北', value: 41398},
              {name: '广西', value: 41150},
              {name: '甘肃', value: 17630},
              {name: '山西', value: 27370},
              {name: '内蒙古', value: 27370},
              {name: '陕西', value: 97208},
              {name: '吉林', value: 88290},
              {name: '福建', value: 19978},
              {name: '贵州', value: 94485},
              {name: '广东', value: 89426},
              {name: '青海', value: 35484},
              {name: '西藏', value: 97413},
              {name: '四川', value: 54161},
              {name: '宁夏', value: 56515},
              {name: '海南', value: 54871},
              {name: '台湾', value: 48544},
              {name: '香港', value: 49474},
              {name: '澳门', value: 34594}
            ]
          }
        ]
      }
    };
  },
  mounted() {
    let myEcharts = echarts.init(this.$refs["echarts-map-china"]);
    myEcharts.setOption(this.options);
  }
};
</script>

<style lang="less" scoped>
.echarts-map-china {
  height: 700px;
  width: 900px;
}
</style>

更多推荐
 已为社区贡献1条内容


所有评论(0)