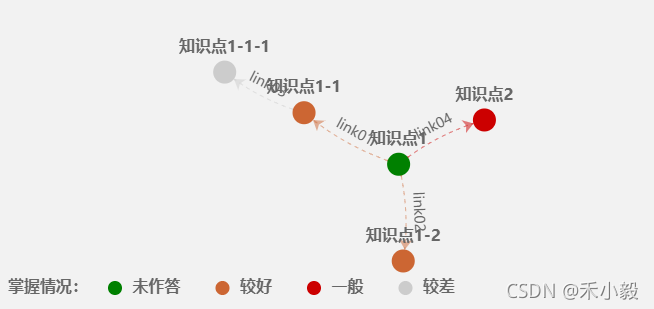
vue实现 【echarts中graph关系图图例】,制作一个知识点的关系图表,其中包含 “点击节点” 和 “提示弹窗按钮点击事件” 实现【页面跳转】
1、安装echartsnpm install echarts --save2、在需要的页面引入import * as echarts from "echarts"KnowChart.vue<template><div><div id="atlasChart"></div></div></template><script&
·

一、安装echarts
npm install echarts --save二、在需要的页面引入
import * as echarts from "echarts"三、创建页面KnowChart.vue
html部分
<template>
  <div>
    <div id="atlasChart"></div>
  </div>
</template>

<style scoped>
#atlasChart{
  width:760px;
  height:350px;
  background: rgba(242, 242, 242, 1);
}
</style>
js部分
<script>
import * as echarts from 'echarts'
export default {
  data () {
    return {
      categories: [],
      types: ['未作答', '较好', '一般', '较差'],
      datas: [
        {id: '1', name: '集合与逻辑用语', category: 1, url: 'knowMath'},
        {id: '2', name: '等式与不等式', category: 1, url: 'knowMath'},
        {id: '3', name: '基本初等函数', category: 1, url: 'knowMath'},
        {id: '4', name: '三角函数', category: 1, url: 'knowMath'},
        {id: '5', name: '平面向量', category: 1, url: 'knowMath'},
        {id: '6', name: '复数', category: 1, url: 'knowMath'},
        {id: '7', name: '空间向量与立体几何', category: 1, url: 'knowMath'},
        {id: '8', name: '直线与圆', category: 1, url: 'knowMath'},
        {id: '9', name: '平面解析几何', category: 1, url: 'knowMath'},
        {id: '10', name: '数列', category: 1, url: 'knowMath'},
        {id: '11', name: '导数', category: 1, url: 'knowMath'},
        {id: '12', name: '计数原理与概率统计', category: 1, url: 'knowMath'}
      ],
      links: [
        {target: '1', name: 'link02', des: 'link02des'},
        {target: '2', name: 'link03', des: 'link03des'},
        {target: '3', name: 'link04', des: 'link05des'},
        {target: '4', name: 'link04', des: 'link05des'},
        {target: '5', name: 'link04', des: 'link05des'},
        {target: '6', name: 'link04', des: 'link05des'},
        {target: '7', name: 'link04', des: 'link05des'},
        {target: '8', name: 'link04', des: 'link05des'},
        {target: '9', name: 'link04', des: 'link05des'},
        {target: '10', name: 'link04', des: 'link05des'},
        {target: '11', name: 'link04', des: 'link05des'},
        {target: '12', name: 'link04', des: 'link05des'}
      ]
    }
  },
  created () {
    this.$nextTick(function () {
      this.montheahcrt()
    })
  },
  methods: {
    montheahcrt () {
      var myChart = echarts.init(document.getElementById('atlasChart'))

      for (var i = 0; i < this.types.length; i++) {
        this.categories[i] = {
          name: this.types[i]
        }
      }
      var option = {
        animationDurationUpdate: 1500,//数据更新动画的时长。
        animationEasingUpdate: 'quinticInOut',//数据更新动画的缓动效果。
        color: ['#008000', '#cc6633', '#c00', '#ccc'],
        title: {
          text: '掌握情况:', // 正标题
          bottom: '20px', // 上下位置
          left: '20px', // 左右位置
          textStyle: { // 图例文字的样式
            fontSize: 16,
            fontWeight: 550,
            color: '#666'
          }
        },
        grid: {
          top: 0,
          bottom: 0,
          left: 0,
          right: 0
        },
        legend: [{
          // selectedMode: 'single',
          // 图例位置
          bottom: '20px',
          left: '120px',
          textStyle: { // 图例文字的样式
            fontSize: 16,
            fontWeight: 550,
            color: '#666'
          },
          icon: 'circle', //  'circle', 'rect', 'roundRect', 'triangle', 'diamond', 'pin', 'arrow'
          itemGap: 35, // 图例之间的间距
          data: this.categories.map(function (a) {
            return a.name
          })
        }],

        series: [{
          type: 'graph', // 类型:关系图
          layout: 'force', // 图的布局,类型为力导图
          focusNodeAdjacency: true, // 当鼠标移动到节点上,突出显示节点以及节点的边和邻接节点
          draggable: true, // 指示节点是否可以拖动
          symbolSize: 23, // 调整节点的大小
          roam: 'scale', // 是否开启鼠标缩放和平移漫游。默认不开启。如果只想要开启缩放或者平移,可以设置成 'scale' 或者 'move'。设置成 true 为都开启
          edgeSymbol: ['circle', 'arrow'], // 边两端的标记类型,可以是一个数组分别指定两端,也可以是单个统一指定。默认不显示标记,常见的可以设置为箭头,如下:edgeSymbol: ['circle', 'arrow']
          edgeSymbolSize: [2, 10], // 边两端的标记大小,可以是一个数组分别指定两端,也可以是单个统一指定。
          edgeLabel: {
            normal: {
              show: false,
              formatter: function (x) {
                return x.data.name
              },
              textStyle: {
                fontSize: 14,
                color: '#666666'
              }
            }
          },
          force: { //力引导图基本配置
            layoutAnimation:true,
            // xAxisIndex : 0, //x轴坐标 有多种坐标系轴坐标选项
            // yAxisIndex : 0, //y轴坐标
            gravity:0.02, //节点受到的向中心的引力因子。该值越大节点越往中心点靠拢。
            edgeLength: 30, //边的两个节点之间的距离,这个距离也会受 repulsion。[10, 50] 。值越小则长度越长
            repulsion: 300 //节点之间的斥力因子。支持数组表达斥力范围,值越大斥力越大。
            // repulsion: 3000, //节点之间的斥力因子。支持数组表达斥力范围,值越大斥力越大。
            // edgeLength: 80 //边的两个节点之间的距离,这个距离也会受 repulsion。[10, 50] 。值越小则长度越长
          },
          lineStyle: {
            normal: {
              width: 1,
              // color: '#4b565b',
              color: 'target', // 决定边的颜色是与起点相同还是与终点相同
              curveness: 0.1,
              type: 'dashed' // 'dotted'点型虚线 'solid'实线 'dashed'线性虚线
            }
          },
          label: {
            show: true,
            position: 'top',
            formatter: '{b}',
            textStyle: {
              fontSize: 16,
              fontWeight: 600,
              color: '#666'
            }
          },
          // 数据
          data: this.datas,
          links: this.links,
          categories: this.categories
        }]
      }
      myChart.setOption(option)
      // 让图表跟随屏幕自动的去适应
      window.addEventListener('resize', function () {
        myChart.resize()
      })
    }
  }
}
</script>页面跳转的2种方式:点击提示窗中的按钮点击事件 / 点击节点
1、点击提示窗中的按钮点击事件
vue中改变echarts 提示窗样式部分,需取消scored,再加class名
以下截图实现弹窗跳转页面

<style lang="scss">
// echarts提示弹窗
.tool_box{
  padding:15px;
  color:#333;
  .tool_title{
    width:400px;
    font-size:32px;
    display: flex;
    align-items: top;
    .tool_title_tag{
      span{
      color:#fff;
      font-size:22px;
      padding:4px 8px;
      background: #03BA82;
      border-radius: 0px 8px 0px 8px;
      margin-right:10px;
      }
    }
    .tool_titles{
      width: 90%;
      white-space:pre-wrap;
      line-height: 35px;
    }
  }
  .tool_site{
    margin:22px 0px 50px 0px;
    font-size:22px;
  }
  .tool_btn{
    outline: none;
    font-size:24px;
    width:100%;
    padding:18px 0;
    color:#fff;
    background: #03ba82;
    border:0;
    border-radius:50px;
  }
}
</style>
在之前 option 基础上,加上 // 提示框的配置 tooltip:{} ,以及弹窗点击事件myAerlt(), 页面跳转函数goDetail ()
其中,在myAerlt函数中,直接使用this调用goDetail ,是找不到 报错undefined,想要使用vue中的函数以及router路由,将vue的this指向赋值给变量给一个变量(let _this = this) ,即可解决
methods: {
// 跳转至详情页
goDetail () {
this.$router.push({name: 'knowMath'})
},
montheahcrt () {
let _this = this // 将vue的this指向赋值给变量,获取到跳转的router路由
function myAerlt (val) {
if (val) {
_this.goDetail()
}
}
window.myAerlt = myAerlt
....
var option = {
title: { ...... },
grid: { ...... },
// 提示框的配置
tooltip: {
triggerOn: 'click',
enterable: true,
formatter: function (x) {
return `<div class="tool_box">
<div class="tool_title">
<div class="tool_title_tag">
<span>必会</span>
</div>
<div class="tool_titles"> ${x.data.name}</div>
</div>
<div class="tool_site">书中位置:必修2P102</div>
<button class="tool_btn" onclick="myAerlt(${x.data.id})" >
针对学<i class="el-icon-right"></i>
</button>
</div>`
},
extraCssText:'width:120px; white-space:pre-wrap' // 文字内换行样式
},
legend:
......
}
......
}
}
2、点击节点
在之前的基础上,添加节点事件
let myChart = echarts.init(document.getElementById('atlasChart'))
myChart.on('click', function (param) {
  if (param.dataType === 'node') {
     // 点击节点
     _this.goDetail()
  } else {
    // 点击边
    console.log('点击了边', param)
  }
})
3、切换数据时,加载慢的的解决方法
A、释放图表 实例不可用 myChart.dispose()
B、清空画布内容 实例可用 myChart.clear()
C、还原图表,各种状态均被清除 myChart.restore()
D、刷新图表 myChart.refresh()
if (this.myChart_ == null) {
  this.myChart_ = echarts.init(document.getElementById(this.id))
} else {
  this.myChart_.dispose()
  this.myChart_ = echarts.init(document.getElementById(this.id))
}
let myChart = this.myChart_
有坑:vue为echarts绑定数据库数据,不显示的问题
此处导致的原因是:将option的内容放在mounted钩子函数了,因此echarts图先渲染出来了,数据没出来。
解决方法:将option与数据库中的数据,执行加载的顺序换一下
希望我的愚见能够帮助你哦~,若有不足之处,还望指出,你们有更好的解决方法,欢迎大家在评论区下方留言支持,大家一起相互学习参考呀~
更多推荐
 已为社区贡献14条内容


所有评论(0)