
我如何使用 Streamlit 构建 Beneish Pass 应用程序🎗️
📘 大家好,这里简要介绍了使用 Streamlit 构建的 Beneish Pass 应用程序。希望这是有道理的。
概览👀
一个简单、流线型的网络应用程序,用于使用不同公司在 2021-2022 年的财务报表来查明公司的收益是否被操纵。
个目标🎯
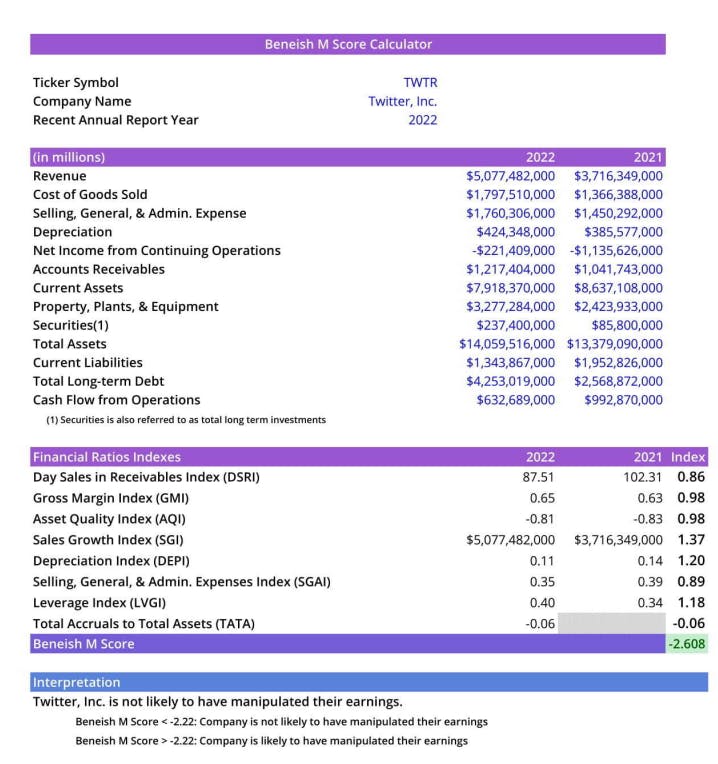
这个网络应用程序基于 Beneish 模型,这是一个数学模型,它使用八个变量和财务比率来确定公司是否操纵了其收益。 M 分数是根据公司的财务报表制作的,以显示收入发生了多少变化。
用例👥
康奈尔大学的学生能够在华尔街弄清楚它有多糟糕之前数年就发现了大型安然公司的操纵行为。这是该模型的常见用途。人们在被认为是历史上最大的欺诈之一中失去了工作、金钱和名誉。世界上最大的审计和会计师事务所之一安达信会计师事务所也失去了声誉。
关于Beneish模型🔍
创作者 - Messod Beneish 教授
目的 - 通过识别危险信号区域来发现金融操纵
Beneish M 分数方程
M-score u003d -4.84 + 0.92 × DSRI + 0.528 × GMI + 0.404 × AQI + 0.892 × SGI + 0.115 × DEPI -0.172 × SGAI + 4.679 × TATA - 0.327 × LVGI

M - 分数
推理
< - 2.22
这家公司不操纵。
> -2.22
这家公司操纵。
下面,您可以了解更多有关 Beneish 模型的信息🔎
[Beneish M 分数 - 维基百科,免费的百科全书
Beneish M 分数
限制❗
🚫 Beneish M-score 是一个概率模型,因此它不能 100% 地检测到收益操纵。金融机构从 Beneish 的 M 分数样本中剔除。
使用的工具📲
🛠 编程语言 - Python🐍
Data Source - yfinance (API), yahooquery 📉
Data analysis - 熊猫🐼
Automation - openpyxl (Python -> Excel) 📊
Web App - Streamlit(框架)🎯
📂custom components - hydralit\组件✨
Data Warehousing - 雪花❄️
Visualization - 剧情📌
Animations - Lottie Files 📍
数据获取📝
from yahooquery import Ticker

# Fetching the Tickers Module

symbols = ['FB', 'AAPL', 'BRK.B', 'TSLA', 'MCD', 'VZ', 'BA', 'NKE', '^GSPC', 'NQ=F', 'ALB', 'AOS', 'APPS', 'AQB', 'ASPN', 'ATHM', 'AZRE', 'BCYC', 'BGNE', 'CAT', 'CC', 'CLAR', 'CLCT', 'CMBM', 'CMT', 'CRDF', 'CYD', 'DE', 'DKNG', 'EMN', 'FBIO', 'FBRX', 'FCX', 'FLXS', 'FMC', 'FMCI', 'GME','GRVY', 'HAIN', 'HBM', 'HIBB', 'IEX', 'IOR', 'GOOGL', 'MAXR', 'MPX', 'MRTX', 'NSTG', 'NVCR', 'NVO', 'OESX', 'PENN', 'PLL', 'PRTK', 'RDY', 'REGI', 'REKR', 'SBE', 'SQM', 'TCON', 'TWTR', 'TGB', 'TRIL', 'UEC', 'VCEL', 'VOXX', 'WIT', 'WKHS', 'XNCR']

# Create Ticker instance, passing symbols as first argument
# Optional asynchronous argument allows for asynchronous requests

tickers = Ticker(symbols, asynchronous=True)
dat = tickers.get_modules("summaryProfile quoteType")
symb = pd.DataFrame.from_dict(dat).T

# flatten dicts within each column, creating new dataframes

dataframes = [pd.json_normalize([x for x in symb[module] if isinstance(
    x, dict)]) for module in ['summaryProfile', 'quoteType']]

# concat dataframes from previous step

symb = pd.concat(dataframes, axis=1)
symb = symb[['shortName', 'symbol']].dropna()
symb = symb.sort_values('symbol')
symb.set_index('shortName', inplace=True, drop=True)
symb = symb.reset_index()  # reset index
symb.index = symb.index + 1  # add 1 to each index
symb.columns = ['Companies', 'Symbol']
data = symb.copy()
symb['Companies'] = symb['Companies'].str.replace("'", "''")
-
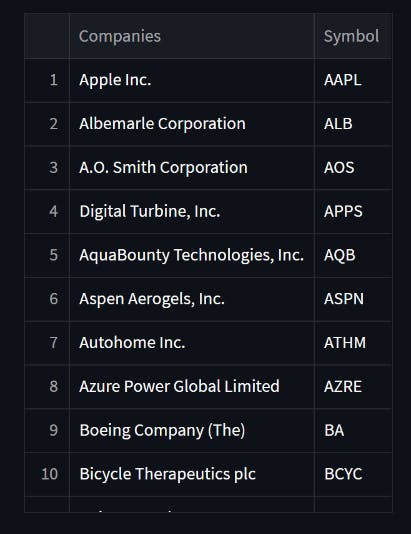
每个公司的符号都放在一个列表中,然后用yahooquery的Ticker模块检索公司名称并放入熊猫数据框。
-
公司名称中的单引号导致难以在数据库中存储,因此将单引号替换为双引号。
数据分析📊
import yfinance as yf

comp = yf.Ticker(symb.at[ch, 'Symbol'])
incomeStatement = comp.financials
balanceSheet = comp.balancesheet
cashFlow = comp.cashflow
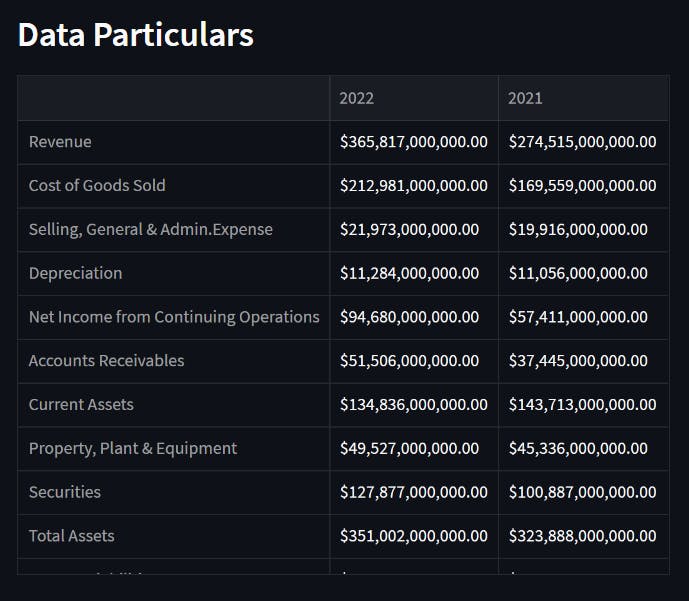
财务报表根据公司的符号(即股票代码)取自雅虎财经
[损益表、资产负债表、现金流量表]
# Cleaning the data

    # Income Statement
    incomeStatement = incomeStatement[incomeStatement.columns[0:2]]
    incomeStatement.columns = ['2022', '2021']
    incomeStatement = incomeStatement.fillna(0).astype(float)

    # Balance Sheet
    balanceSheet = balanceSheet[balanceSheet.columns[0:2]]
    balanceSheet.columns = ['2022', '2021']
    balanceSheet = balanceSheet.fillna(0).astype(float)

    # Cash Flow
    cashFlow = cashFlow[cashFlow.columns[0:2]]
    cashFlow.columns = ['2022', '2021']
    cashFlow.dropna()
获取 2021 年和 2022 年每个语句的详细信息,并删除空值。此外,必须检索相关详细信息并将其保存在不同的数据框中以计算 m 分数。我没有显示代码,因为它使博客更长;您可以参考最后链接的源代码。
数据评估🧮
函数.py
def DSRI(df):
    return (df.at["Accounts Receivables", "2022"] / df.at["Revenue", "2022"]) / (df.at["Accounts Receivables", "2021"] / df.at["Revenue", "2021"])

def GMI(df):
    return ((df.at["Revenue", "2021"] - df.at["Cost of Goods Sold", "2021"])/df.at["Revenue", "2021"]) / ((df.at["Revenue", "2022"] - df.at["Cost of Goods Sold", "2022"])/df.at["Revenue", "2022"])

def AQI(df):
    AQI_t1 = (1 - (df.at["Current Assets", "2022"] +
              df.at["Property, Plant & Equipment", "2022"]+df.at["Securities", "2022"])) / df.at["Total Assets", "2022"]
    AQI_t2 = (1 - (df.at["Current Assets", "2021"] +
              df.at["Property, Plant & Equipment", "2021"]+df.at["Securities", "2021"])) / df.at["Total Assets", "2021"]
    return AQI_t1 / AQI_t2

def SGI(df):
    return (df.at["Revenue", "2022"] / df.at["Revenue", "2021"])

def DEPI(df):
    DEPI_t1 = (df.at["Depreciation", "2021"] / (df.at["Depreciation",
               "2021"] + df.at["Property, Plant & Equipment", "2021"]))
    DEPI_t2 = (df.at["Depreciation", "2022"] / (df.at["Depreciation",
               "2022"] + df.at["Property, Plant & Equipment", "2022"]))
    return DEPI_t1 / DEPI_t2

def SGAI(df):
    return (df.at["Selling, General & Admin.Expense", "2022"] / df.at["Revenue", "2022"]) / (df.at["Selling, General & Admin.Expense", "2021"] / df.at["Revenue", "2021"])

def LVGI(df):
    return ((df.at["Current Liabilities", "2022"] + df.at["Total Long-term Debt", "2022"]) / df.at["Total Assets", "2022"]) / ((df.at["Current Liabilities", "2021"] + df.at["Total Long-term Debt", "2021"]) / df.at["Total Assets", "2021"])

def TATA(df):
    return (df.at["Net Income from Continuing Operations", "2022"] - df.at["Cash Flow from Operations", "2022"]) / df.at["Total Assets", "2022"]

def BeneishMScore(dsri, gmi, aqi, sgi, depi, sgai, lvgi, tata):
    return -4.84+0.92*dsri+0.528*gmi+0.404*aqi+0.892*sgi+0.115*depi-0.172*sgai+4.679*tata-0.327*lvgi
# Beneish M Score
    m_score = BeneishMScore(DSRI(data),
                            GMI(data),
                            AQI(data),
                            SGI(data),
                            DEPI(data),
                            SGAI(data),
                            LVGI(data),
                            TATA(data))
    if(m_score < -2.22):
        res = '##### Company is not likely to manipulate their earnings'
        st.write(f"##### M- Score = {round(m_score,2)}")
        st.write(f"{res}")
        # print(res)
    else:
        res = " ##### Company is not likely to manipulate their earnings"
        st.write(f"##### M- Score = {round(m_score,2)}")
        st.write(f"{res}"
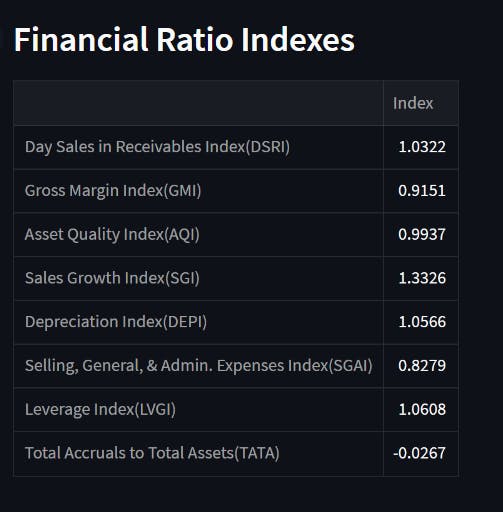
上述函数用于计算 m-score 并进行解释。

可视化🎴
import plotly.express as px

# The Line Chart using Plotly
    fig = px.line(
        temp_ratios,  # Data Frame
        x="Index",  # Columns from the data frame
        y="Ratios",
        title="Financial Ratio Indexes",
    )
    fig.update_traces(line_color="blue")

 with st.container():
      st.plotly_chart(fig)
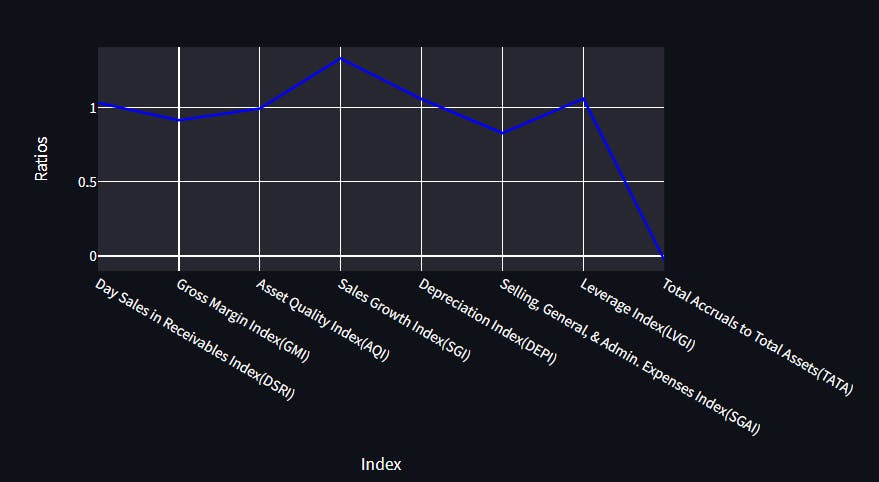
只需调用st.plotly chart()即可获得流线图中的绘图图表,并且您可以制作不同类型的图表,如折线图和条形图。
数据仓库💽
要求 - Snowflake 帐户将 Streamlit 连接到 Snowflake - Streamlit Docs
为什么要使用数据库?
我的最终目标是记住这些信息,以便将其结果与未来的结果进行比较。也就是说,计算出的每家公司的 m-score 值可以存储在数据库表中,并与未来几年相同公司的未来 m-score 值进行比较。
import snowflake.connector as sf

# SnowFlake  Initialize connection.
    def init_connection():
        return sf.connect(**st.secrets["snowflake"])

    conn = init_connection()

    cur = conn.cursor()
使用此代码块初始化连接
try:
cur.execute(
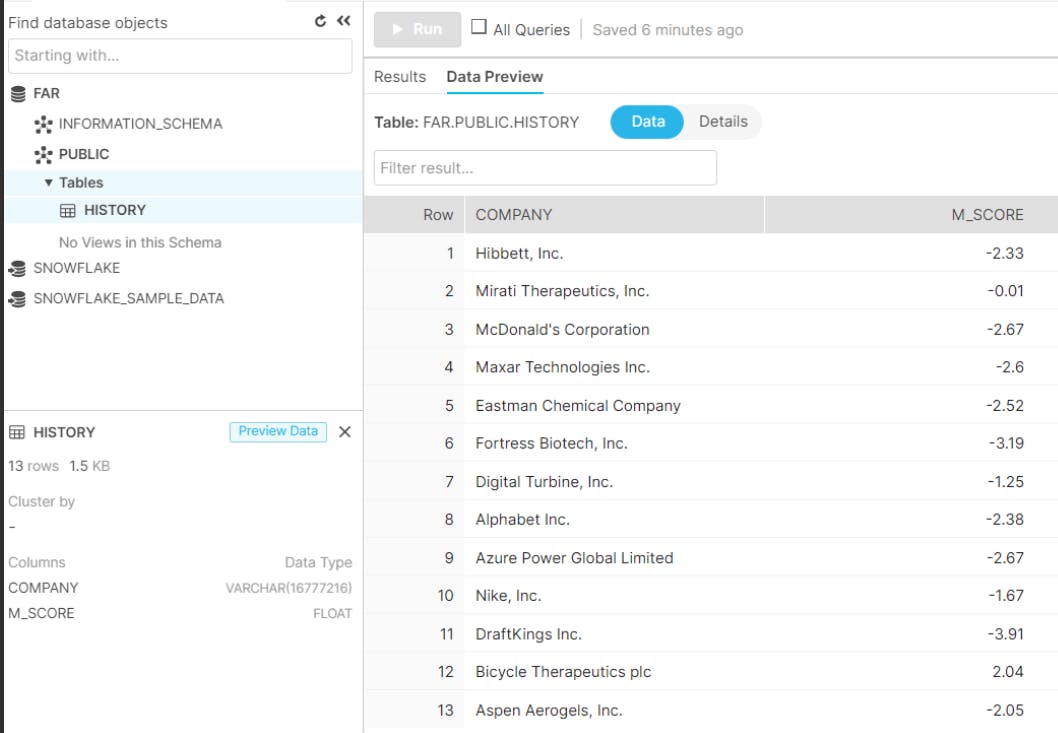
f"INSERT INTO FAR.PUBLIC.HISTORY(COMPANY,M_SCORE) VALUES('{symb.at[ch, 'Companies']}',{round(m_score,2)})")
cur.execute('''DELETE FROM FAR.PUBLIC.HISTORY WHERE (COMPANY) in
(SELECT COMPANY FROM FAR.PUBLIC.HISTORY GROUP BY COMPANY HAVING COUNT(COMPANY)> 1)
''')
cur.execute(
'SELECT * FROM FAR.PUBLIC.HISTORY')
finally:
cur.close()
conn.close()
-
用户首次输入后,公司名称及其 m-score 将被保存。
-
当用户为同一公司输入条目时,重复条目将被删除并再次在数据库中更新。这样做是为了摆脱冗余数据并充分利用空间。
❗ 挑战
- 对我来说,第一个重大问题是找到一个数据源,为我提供其符号的公司名称(例如,AAPL - Apple Inc.),因为用户很难使用符号搜索特定公司。
✅ 所以我使用了 yahooquery 模块。
-
接下来我遇到的是编写手动公式来计算一些公司遗漏的细节,比如销货成本和长期债务。
-
最后一个挑战是将信息添加到数据库而不复制它。我也很难将公司名称添加到数据库表中。
例如,博士。雷迪实验室有限公司。不能直接存储,因为它有单引号。由于是字符串,Snowflake 会将其显示为 "Dr. Reddy's Laboratory Ltd." 将 Snowflake 的单引号改为双引号 "Dr. Reddy's Laboratory Ltd." 这样数据可以添加到数据库

实现就差不多了,我最喜欢的部分是现在给我的代码一个带有Streamlit的 GUI 外观和使用openpyxl的自动化(仅适用于本地系统)。让我们从自动化开始。使用 Python 的 openpyxl 模块, 您可以轻松地操作 excel 表格。
自动化🤖

from openpyxl import Workbook, load_workbook

# Excel Automation

    wb = load_workbook('Beneish-M-Score.xlsx')
    ws = wb.active

    while True:   # repeat until the try statement succeeds
        try:
            # or "a+", whatever you need
            myfile = open("Beneish-M-Score.xlsx", "r+")
            break
            # exit the loop
        except IOError:
            print("Failed to open!!")

    ws['C3'].value = symb.at[ch, 'Symbol']
    ws['C4'].value = symb.at[ch, 'Companies']

    excel_data = data.reset_index(drop=True)
    excel_data.index = excel_data.index + 1

    for row in range(8, 21):
        for col in range(3, 5):
            char = chr(65 + col)
            if char == 'D':
                ws[char + str(row)] = excel_data.at[row-7, "2022"]
            if char == 'E':
                ws[char + str(row)] = excel_data.at[row-7, "2021"]

    wb.save('Beneish-M-Score.xlsx')
-
On 预先制作好计算工作簿的模板,并加载工作簿。
-
这个过程非常简单,用户所要做的就是为某个公司输入一个条目。使用自动化,Excel 工作表用于更新相应单元格中的数据。
❗ 在运行代码之前关闭 Excel。
Streamlit⚡

Streamlit 的有趣和令人兴奋的部分现在在这里。 我从哪里得到这个想法?
我故意把我对 Streamlit 的讨论放到最后,因为关于它还有很多话要说。在我们详细介绍之前,您可能想知道,“什么是 Streamlit?”。所以,你有它。
Streamlit 是一个基于 Python 的开源应用程序框架。多亏了它,我们的数据科学和机器学习网络应用程序的开发速度要快得多。 Scikit-Learn、Keras、PyTorch、SymPy(latex)、NumPy、pandas 和 Matplotlib 只是它使用的一些流行的 Python 库。
❗ 想了解更多关于 Streamlit 的信息?见Streamlit.io
现在由 Streamlit 将我的代码及其组件塑造成一个 WEB 应用程序🕸️。
import streamlit as st
from streamlit_lottie import st_lottie
import hydralit_components as hc

# Streamlit Page Configuration

st.set_page_config(
    page_title="FA",
    page_icon="chart_with_upwards_trend",
    layout="wide",
    initial_sidebar_state="expanded"
)

hide_st_style = """
<style>
#MainMenu {visibility: hidden;}
header{visibility: hidden;}
footer {visibility: hidden;}
</style>

"""
st.markdown(hide_st_style, unsafe_allow_html=True)

# ---Side-Bar----

with st.sidebar:
    st_lottie(lottie_hello, loop=True, key=None, height=320, width=320)
    st.write(''' It's a DEMO!! ''')
使用此代码,我可以设置我的 Web 应用程序的基本设置和线框。
def load_lottiefile(filepath: str):
    with open(filepath, "r") as f:
        return json.load(f)

lottie_analysis = load_lottiefile("lottiefiles/analysis.json")
lottie_hello = load_lottiefile("lottiefiles/hello.json")
Streamlit 的自定义组件还可以加载 Lottie 动画,可以用来炫耀一些令人惊叹的插图
# -----Home Page-----

st.title("Analyzing the Quality of Financial Statements using Beneish Model")
with st.container():
    left_col, right_col = st.columns((2, 1))
    with left_col:
        st.dataframe(data)
    with right_col:
        st_lottie(lottie_analysis, height="300",
                  width="500", quality="high", key=None)
# -- Input----

ch = st.number_input('Enter a  number: ')
在st.container()内部,有两个单独的列,一侧显示有关公司的信息,而另一侧显示动画。也可以使用st.number input()进行用户输入
with hc.HyLoader('Now doing loading', hc.Loaders.standard_loaders, index=[3, 0, 5]):
Hydralit 组件可用于显示加载动画以隐藏运行时编译代码所需的时间。
# The Line Chart using Plotly
    fig = px.line(
        temp_ratios,  # Data Frame
        x="Index",  # Columns from the data frame
        y="Ratios",
        title="Financial Ratio Indexes",
    )
    fig.update_traces(line_color="blue")

    with st.container():
        st.plotly_chart(fig)

# Streamlit Buttons
history = cur.fetch_pandas_all()
if st.button("View History"):
        st.snow()
        st.dataframe(history)
如前所述,图表可以用流光制作,状态元素可以用st.snow()制作,以获得醒目的视觉效果,按钮也可以用st.button()制作。
叹! 😮u200d💨

真是拖累😦!我认为博客应该很短!我们的博客快结束了,我们将用这篇文章来结束。感谢您花时间阅读并从我的写作中受益。更多有趣的项目正在进行中,我会及时通知大家。现在,保持增长💗,每天提高 1%。
查看Beneish Pass网站。
源代码
https://github.com/VidhyaVarshanyJS/FAStreamlit
和平:)🕊️
关注我了解更多信息:💗LinkedInTwitterGithub

ModelScope旨在打造下一代开源的模型即服务共享平台,为泛AI开发者提供灵活、易用、低成本的一站式模型服务产品,让模型应用更简单!
更多推荐
 0
0 0
0- 0


 已为社区贡献27134条内容

所有评论(0)