

I have a Kubernetes cluster running the a PostgreSQL database, a Grafana dashboard, and a Python single-run application (built as a Docker image) that runs hourly inside a Kubernetes CronJob (see manifests below). Additionally, this is all being deployed using ArgoCD with Istio side-car injection.
The issue I'm having (as the title indicates) is that my Python application cannot connect to the database in the cluster. This is very strange to me since the dashboard, in fact, can connect to the database so I'm not sure what might be different for the Python app.
Following are my manifests (with a few things changed to remove identifiable information):
Contents of database.yaml:
---
apiVersion: apps/v1
kind: Deployment
metadata:
  labels:
    app: database
  name: database
spec:
  replicas: 1
  selector:
    matchLabels:
      app: database
  strategy: {}
  template:
    metadata:
      labels:
        app: database
    spec:
      containers:
      - image: postgres:12.5
        imagePullPolicy: ""
        name: database
        ports:
        - containerPort: 5432
        env:
          - name: POSTGRES_DB
            valueFrom:
              secretKeyRef:
                name: postgres-secret
                key: POSTGRES_DB
          - name: POSTGRES_USER
            valueFrom:
              secretKeyRef:
                name: postgres-secret
                key: POSTGRES_USER
          - name: POSTGRES_PASSWORD
            valueFrom:
              secretKeyRef:
                name: postgres-secret
                key: POSTGRES_PASSWORD
        resources: {}
        readinessProbe:
          initialDelaySeconds: 30
          tcpSocket:
            port: 5432
      restartPolicy: Always
      serviceAccountName: ""
      volumes: null
status: {}
---
apiVersion: v1
kind: Service
metadata:
  labels:
    app: database
  name: database
spec:
  ports:
  - name: "5432"
    port: 5432
    targetPort: 5432
  selector:
    app: database
status:
  loadBalancer: {}
Contents of dashboard.yaml:
---
apiVersion: apps/v1
kind: Deployment
metadata:
  labels:
    app: dashboard
  name: dashboard
spec:
  replicas: 1
  selector:
    matchLabels:
      app: dashboard
  strategy: {}
  template:
    metadata:
      labels:
        app: dashboard
    spec:
      containers:
      - image: grafana:7.3.3
        imagePullPolicy: ""
        name: dashboard
        ports:
          - containerPort: 3000
        resources: {}
        env:
          - name: POSTGRES_DB
            valueFrom:
              secretKeyRef:
                name: postgres-secret
                key: POSTGRES_DB
          - name: POSTGRES_USER
            valueFrom:
              secretKeyRef:
                name: postgres-secret
                key: POSTGRES_USER
          - name: POSTGRES_PASSWORD
            valueFrom:
              secretKeyRef:
                name: postgres-secret
                key: POSTGRES_PASSWORD
        volumeMounts:
          - name: grafana-datasource
            mountPath: /etc/grafana/provisioning/datasources
        readinessProbe:
          initialDelaySeconds: 30
          httpGet:
            path: /
            port: 3000
      restartPolicy: Always
      serviceAccountName: ""
      volumes:
        - name: grafana-datasource
          configMap:
            defaultMode: 420
            name: grafana-datasource
        - name: grafana-dashboard-provision
status: {}
---
apiVersion: v1
kind: Service
metadata:
  labels:
    app: dashboard
  name: dashboard
spec:
  ports:
  - name: "3000"
    port: 3000
    targetPort: 3000
  selector:
    app: dashboard
status:
  loadBalancer: {}
Contents of cronjob.yaml:
---
apiVersion: batch/v1beta1
kind: CronJob
metadata:
  name: python
spec:
  concurrencyPolicy: Replace
  # TODO: Go back to hourly when finished testing/troubleshooting
  # schedule: "@hourly"
  schedule: "*/15 * * * *"
  jobTemplate:
    spec:
      template:
        spec:
          containers:
          - image: python-tool:1.0.5
            imagePullPolicy: ""
            name: python
            args: []
            command:
              - /bin/sh
              - -c
              - >-
                echo "$(POSTGRES_USER)" > creds/db.creds;
                echo "$(POSTGRES_PASSWORD)" >> creds/db.creds;
                echo "$(SERVICE1_TOKEN)" > creds/service1.creds;
                echo "$(SERVICE2_TOKEN)" > creds/service2.creds;
                echo "$(SERVICE3_TOKEN)" > creds/service3.creds;
                python3 -u main.py;
                echo "Job finished with exit code $?";
            env:
              - name: POSTGRES_DB
                valueFrom:
                  secretKeyRef:
                    name: postgres-secret
                    key: POSTGRES_DB
              - name: POSTGRES_USER
                valueFrom:
                  secretKeyRef:
                    name: postgres-secret
                    key: POSTGRES_USER
              - name: POSTGRES_PASSWORD
                valueFrom:
                  secretKeyRef:
                    name: postgres-secret
                    key: POSTGRES_PASSWORD
              - name: SERVICE1_TOKEN
                valueFrom:
                  secretKeyRef:
                    name: api-tokens-secret
                    key: SERVICE1_TOKEN
              - name: SERVICE2_TOKEN
                valueFrom:
                  secretKeyRef:
                    name: api-tokens-secret
                    key: SERVICE2_TOKEN
              - name: SERVICE3_TOKEN
                valueFrom:
                  secretKeyRef:
                    name: api-tokens-secret
                    key: SERVICE3_TOKEN
          restartPolicy: OnFailure
          serviceAccountName: ""
status: {}
Now, as I mentioned Istio is also a part of this picture so I have a Virtual service for the dashboard since it should be accessible outside of the cluster, but that's it.
With all of that out of the way, here's what I've done to try and solve this, myself:
-
Confirm the
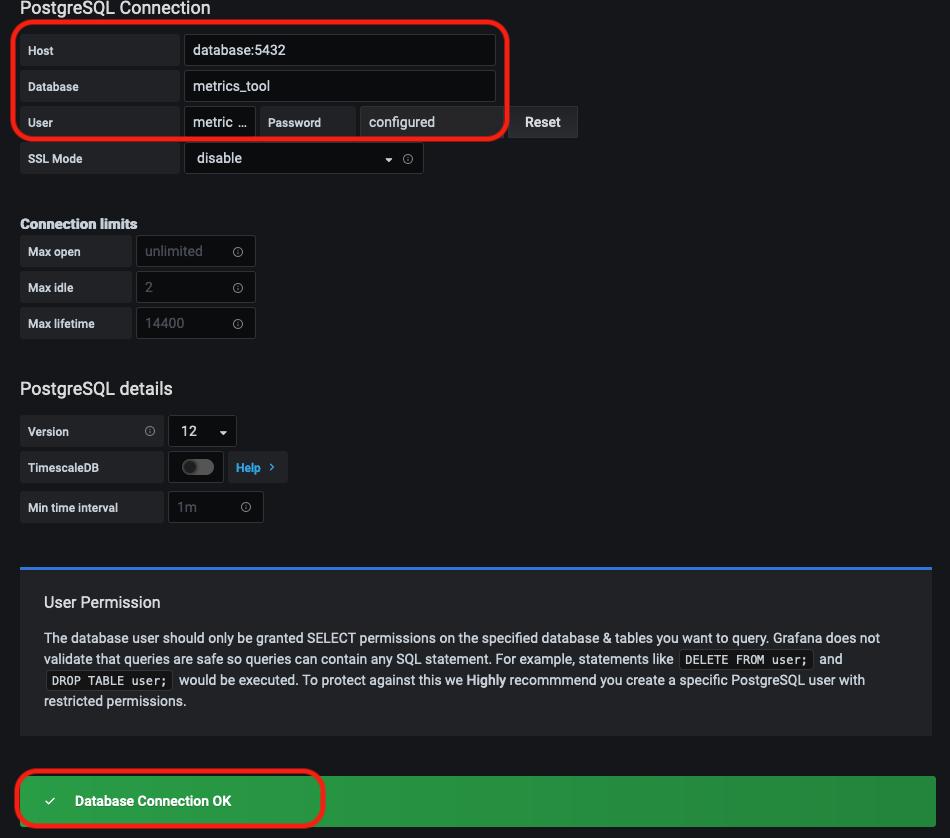
CronJobis using the correct connection settings (i.e. host, database name, username, and password) for connecting to the database.For this, I added echo statements to the
CronJobdeployment showing the username and password (I know, I know) and they were the expected values. I also know those were the correct connection settings for the database because I used them verbatim to connect the dashboard to the database, which gave a successful connection.The data source settings for the Grafana dashboard:
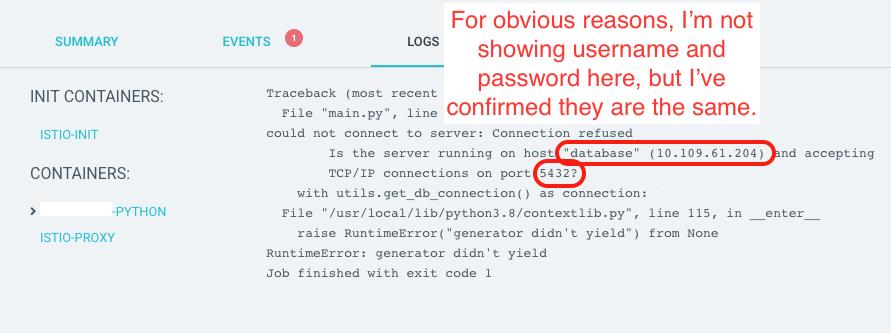
The error message from the Python application (shown in the ArgoCD logs for the container):
-
Thinking Istio might be causing this problem, I tried disabling Istio side-car injection for the
CronJobresource (by adding this annotation to themetadata.annotationssection:sidecar.istio.io/inject: false) but the annotation never actually showed up in the Argo logs and no change was observed when theCronJobwas running. -
I tried
kubectl execing into theCronJobcontainer that was running the Python script to debug more but was never actually able to since the container exited as soon as the connection error occurs.
That said, I've been banging my head into a wall for long enough on this. Could anyone spot what I might be missing and point me in the right direction, please?


 已为社区贡献20439条内容

所有评论(0)