如何使用Prometheus 和Grafana 监控PosgreSQL |码头工人
·
1.Docker撰写
version: "3.9"
services:
  grafana:
    image: grafana/grafana
    ports:
      - 3000:3000

  prometheus:
    image: prom/prometheus
    ports:
      - 9090:9090
    volumes:
      - ./prometheus.yml:/etc/prometheus/prometheus.yml:ro

  postgres:
    image: postgres:12
    ports:
      - 5432:5432
    volumes:
      - ./backup:/var/lib/postgresql/data
    environment:
      POSTGRES_PASSWORD: postgrespassword
      POSTGRES_DB: shop

  postgres-exporter:
    image: prometheuscommunity/postgres-exporter
    ports:
      - 9187:9187
    environment:
      DATA_SOURCE_NAME: "postgresql://postgres:postgrespassword@postgres:5432/shop?sslmode=disable"
    links:
      - postgres
      - prometheus
2.Prometheus 文件设置(prometheus.yml)
global:
  scrape_interval: 15s
  evaluation_interval: 15s

scrape_configs:
  - job_name: prometheus
    static_configs:
      - targets: ["localhost:9090"]
  - job_name: postgres-exporter
    static_configs:
      - targets: ["postgres-exporter:9187"]
3.运行Docker Compose
docker-compose up
4.检查Prometheus和PostgreSQL Exporter的状态
http://localhost:9090/targets
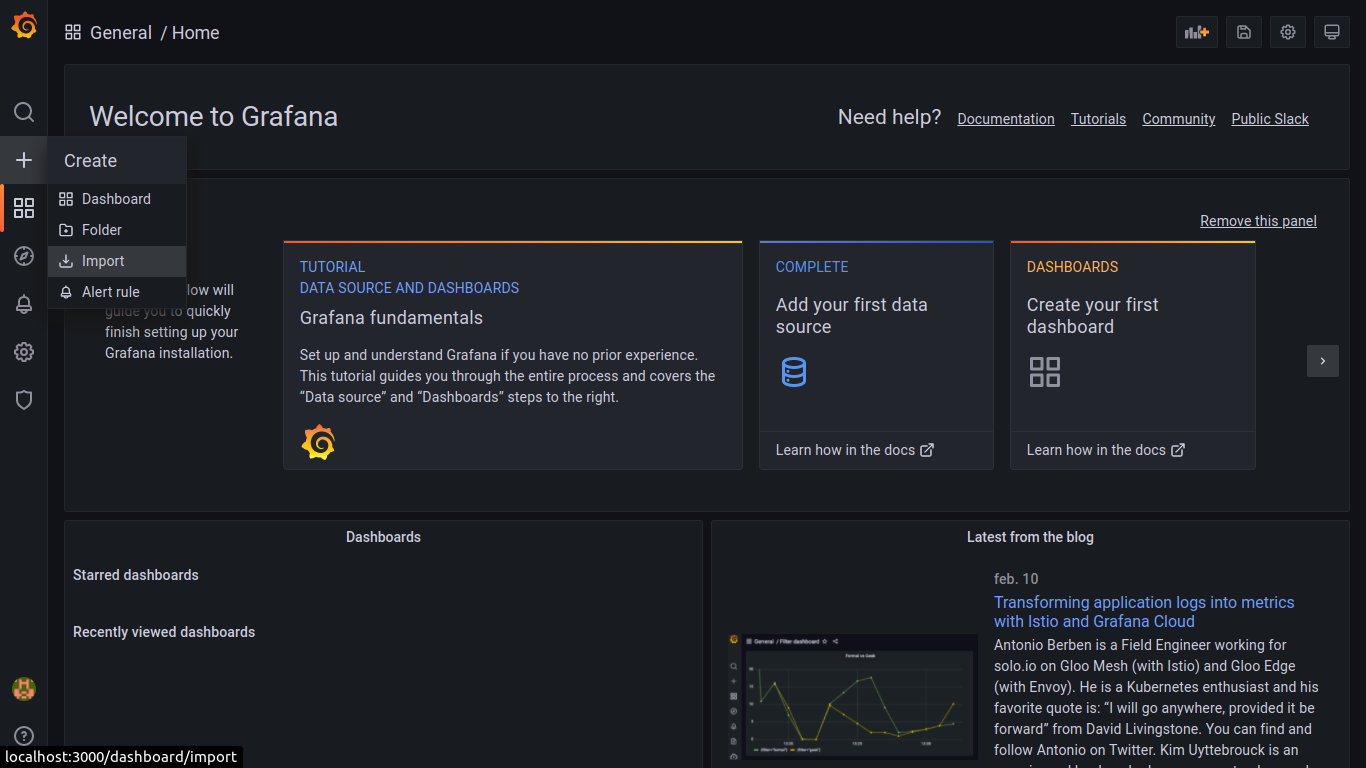
5.访问 Grafana 仪表板
默认
用户:admin 密码:admin
http://localhost:3000

6.添加数据源
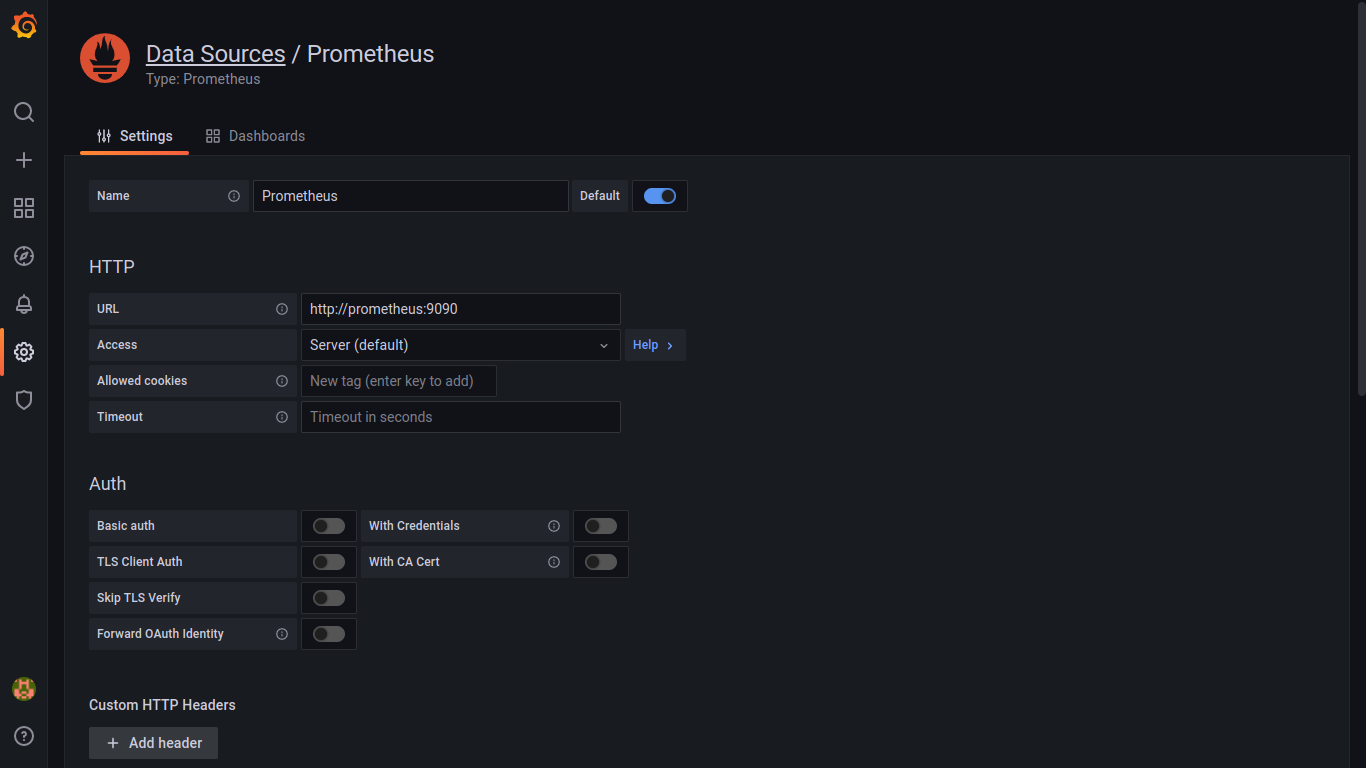
保存并测试

7.为Prometheus导入PostgreSQL仪表板
为此,我们将使用社区创建的仪表板
grafana.com/grafana/dashboards/9628
8.导入JSON或代码
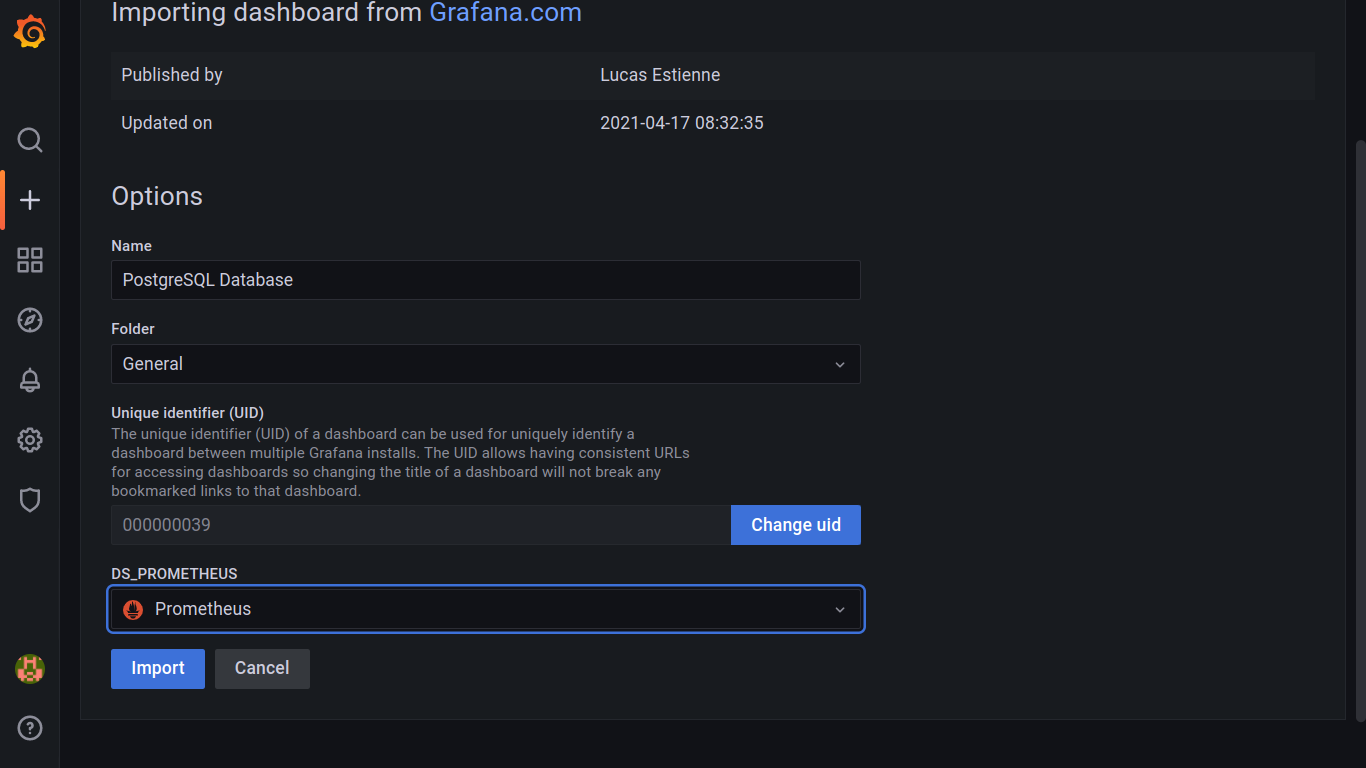
代码:9628
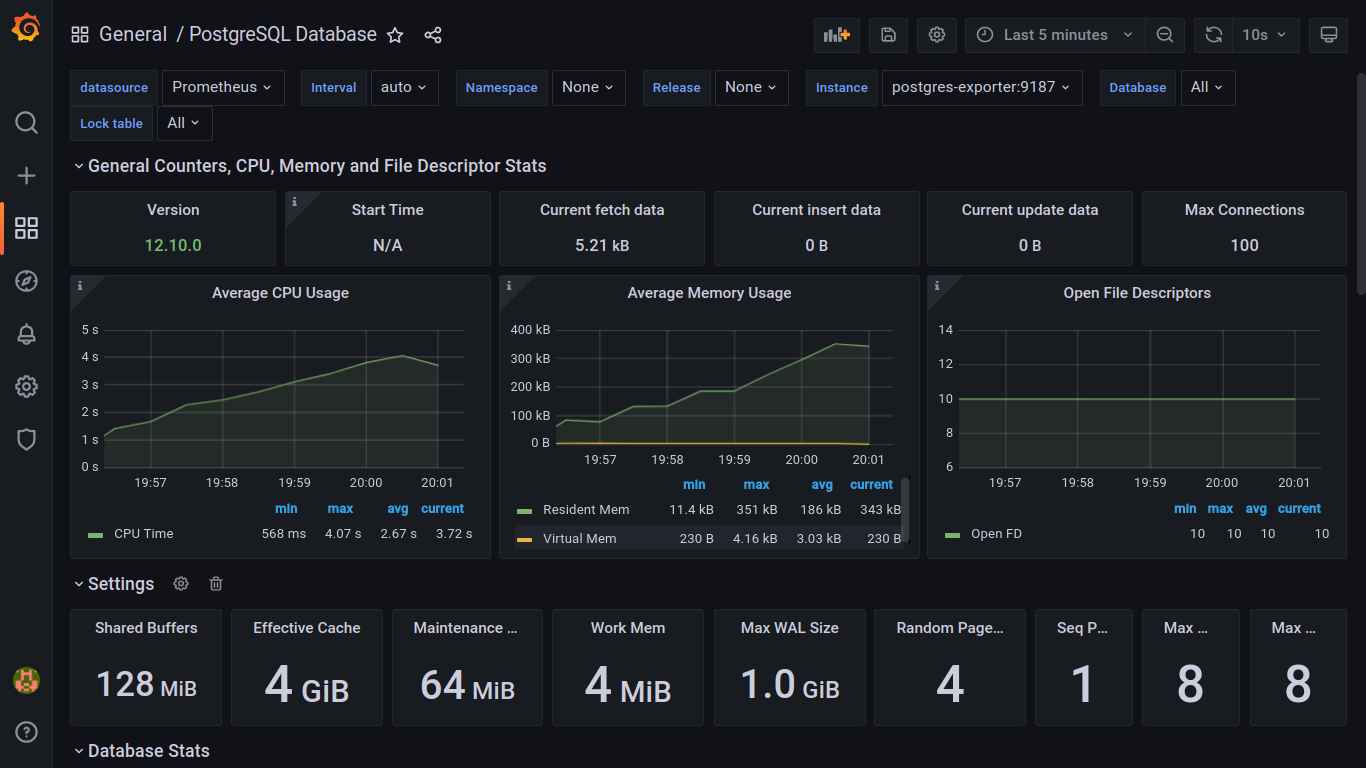
9.仪表板
示例代码(GitHub Gist)
gist.github.com/nelsoncode019/1c0f7930aab75..

K8S/Kubernetes社区为您提供最前沿的新闻资讯和知识内容
更多推荐
 0
0 0
0- 0


 已为社区贡献20439条内容

所有评论(0)