How to remove "Waiting for the debugger to disconnect..." from VSCode console
Answer a question
When I run anything in the VSCode console it shows
Debugger listening on ws://127.0.0.1:51890/cf1cb459-52b1-447f-8f78-aa5e8ff4caef
For help, see: https://nodejs.org/en/docs/inspector
Debugger attached.
Waiting for the debugger to disconnect...
It can get really annoying and distracting, for example when running npm run build within the root folder of my project, I get
...
Single-sourcing version 1.75.47 ./package.json → ./wiki/Install.md (vss @ vss.js:18)
Version single-sourced successfully. (vssEverything @ vss.js:56)
Waiting for the debugger to disconnect...
Waiting for the debugger to disconnect...
Debugger listening on ws://127.0.0.1:52359/30b1bfed-fe8a-4029-865f-33d90d7b1125
For help, see: https://nodejs.org/en/docs/inspector
Debugger attached.

> ccxt@1.75.47 copy-python-files
> npm run copy-python-package && npm run copy-python-license && npm run copy-python-keys && npm run copy-python-readme

Debugger listening on ws://127.0.0.1:52362/b333d457-5501-469d-884f-cc43013bcbac
For help, see: https://nodejs.org/en/docs/inspector
Debugger attached.

> ccxt@1.75.47 copy-python-package
> node build/copy package.json python/package.json

Debugger listening on ws://127.0.0.1:52366/d38e4e81-c873-43f5-844c-b3e866ab70ab
For help, see: https://nodejs.org/en/docs/inspector
Debugger attached.
Copied package.json → python/package.json (<anonymous> @ copy.js:21)
Waiting for the debugger to disconnect...
Waiting for the debugger to disconnect...
Debugger listening on ws://127.0.0.1:52369/26fe0dac-96e9-4670-8203-373b0b0d1496
For help, see: https://nodejs.org/en/docs/inspector
Debugger attached.

> ccxt@1.75.47 copy-python-license
> node build/copy LICENSE.txt python/LICENSE.txt

Debugger listening on ws://127.0.0.1:52372/6403694a-eb8c-4569-aa5e-8389ac49019d
For help, see: https://nodejs.org/en/docs/inspector
Debugger attached.
Copied LICENSE.txt → python/LICENSE.txt (<anonymous> @ copy.js:21)
Waiting for the debugger to disconnect...
Waiting for the debugger to disconnect...
Debugger listening on ws://127.0.0.1:52375/1a00964d-1430-4adb-aada-5f4a57f79c9e
For help, see: https://nodejs.org/en/docs/inspector
Debugger attached.

> ccxt@1.75.47 copy-python-keys
> node build/copy keys.json python/keys.json

Debugger listening on ws://127.0.0.1:52378/c4ed3532-fd4d-4219-a948-0c8d8df2aca4
For help, see: https://nodejs.org/en/docs/inspector
Debugger attached.
Copied keys.json → python/keys.json (<anonymous> @ copy.js:21)
Waiting for the debugger to disconnect...
Waiting for the debugger to disconnect...
Debugger listening on ws://127.0.0.1:52381/8cc353a9-7d45-4fff-8c8e-f433bef956c6
For help, see: https://nodejs.org/en/docs/inspector
Debugger attached.

> ccxt@1.75.47 copy-python-readme
> node build/copy README.md python/README.md

Debugger listening on ws://127.0.0.1:52384/5147b76f-1ad0-4c21-934f-acfd98329745
For help, see: https://nodejs.org/en/docs/inspector
Debugger attached.
Copied README.md → python/README.md (<anonymous> @ copy.js:21)
Waiting for the debugger to disconnect...
Waiting for the debugger to disconnect...
Waiting for the debugger to disconnect...
Debugger listening on ws://127.0.0.1:52387/3e7f92f1-6a7f-4860-b2a1-fb22ef0ee851
For help, see: https://nodejs.org/en/docs/inspector
Debugger attached.

> ccxt@1.75.47 check-js-syntax
> node -e "console.log(process.cwd())" && eslint --version && eslint "js/*.js" --cache --cache-location .cache/eslintcache --cache-strategy metadata

Debugger listening on ws://127.0.0.1:52390/51818977-0d73-4a12-99d3-bff2a32013b6
For help, see: https://nodejs.org/en/docs/inspector
Debugger attached.
/Users/sam/Documents/dev/CCXT/ccxt
Waiting for the debugger to disconnect...
Debugger listening on ws://127.0.0.1:52393/dafd01be-ae41-4e69-aa15-71708e3958b7
For help, see: https://nodejs.org/en/docs/inspector
Debugger attached.
v8.8.0
Waiting for the debugger to disconnect...
Debugger listening on ws://127.0.0.1:52396/ae193df2-afb7-4157-9bd7-7090aac6a63b
For help, see: https://nodejs.org/en/docs/inspector
Debugger attached.
Waiting for the debugger to disconnect...
Waiting for the debugger to disconnect...
Debugger listening on ws://127.0.0.1:52399/381dc316-b3ba-482e-ad94-1eed5b7768a6
For help, see: https://nodejs.org/en/docs/inspector
Debugger attached.

> ccxt@1.75.47 browserify
> browserify ./ccxt.browser.js > ./dist/ccxt.browser.js

Debugger listening on ws://127.0.0.1:52402/8f8a22d8-1bc6-4a56-892c-f25ad6aa7658
For help, see: https://nodejs.org/en/docs/inspector
Debugger attached.
Waiting for the debugger to disconnect...
Waiting for the debugger to disconnect...
Waiting for the debugger to disconnect...
Debugger listening on ws://127.0.0.1:52406/8c4655cf-fb3b-4091-8269-cbadde6686f5
For help, see: https://nodejs.org/en/docs/inspector
Debugger attached.

> ccxt@1.75.47 transpile
> node build/transpile

Debugger listening on ws://127.0.0.1:52411/7d1ba3ae-5cd5-4a6a-98a0-c2b0b501e569
For help, see: https://nodejs.org/en/docs/inspector
Debugger attached.
...
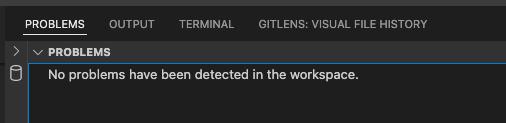
The problems tab shows No problems have been detected in the workspace
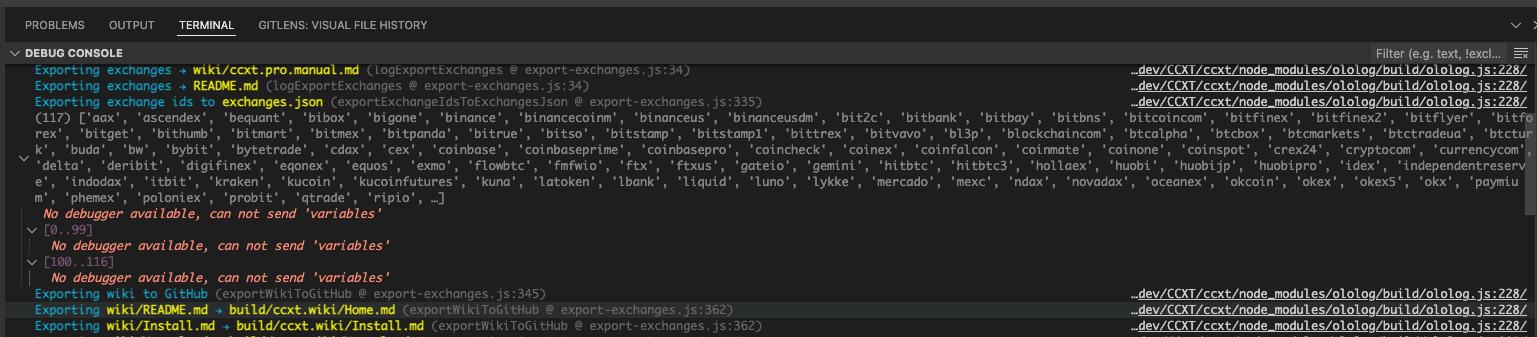
But my debug console shows No debugger available, cannot send 'variables'
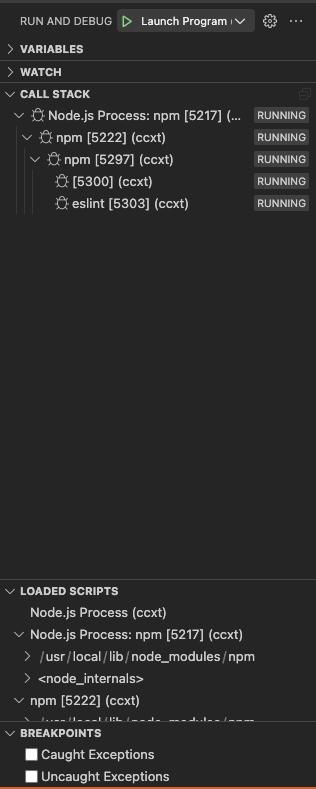
I can see that a bunch of processes start in my Run and Debug tab, but I don't really know what to do about them
Launch.json
{
    "version": "0.2.0",
    "configurations": [
        {
          "type": "pwa-node",
          "request": "launch",
          "name": "Launch Program",
          "program": "${workspaceRoot}/examples/js/cli.js",
          "console": "integratedTerminal",
          "outputCapture": "std"
        }
    ]
  }
Answers
As per my understanding this is caused due to 2 main reason, first one is when you use --inspect flag with node command then it automatically attach a debugger to your process you can read more about this on official node website - https://nodejs.org/en/docs/guides/debugging-getting-started/#enable-inspector.
If its not the first case then second reason is your IDE's setting, in VS code we can configure our debugger to attach with any node process automatically be sure to configure it properly.
To open the settings tab press "⌘," for MAC and "CTRL+," in windows. Search for auto attach filter.
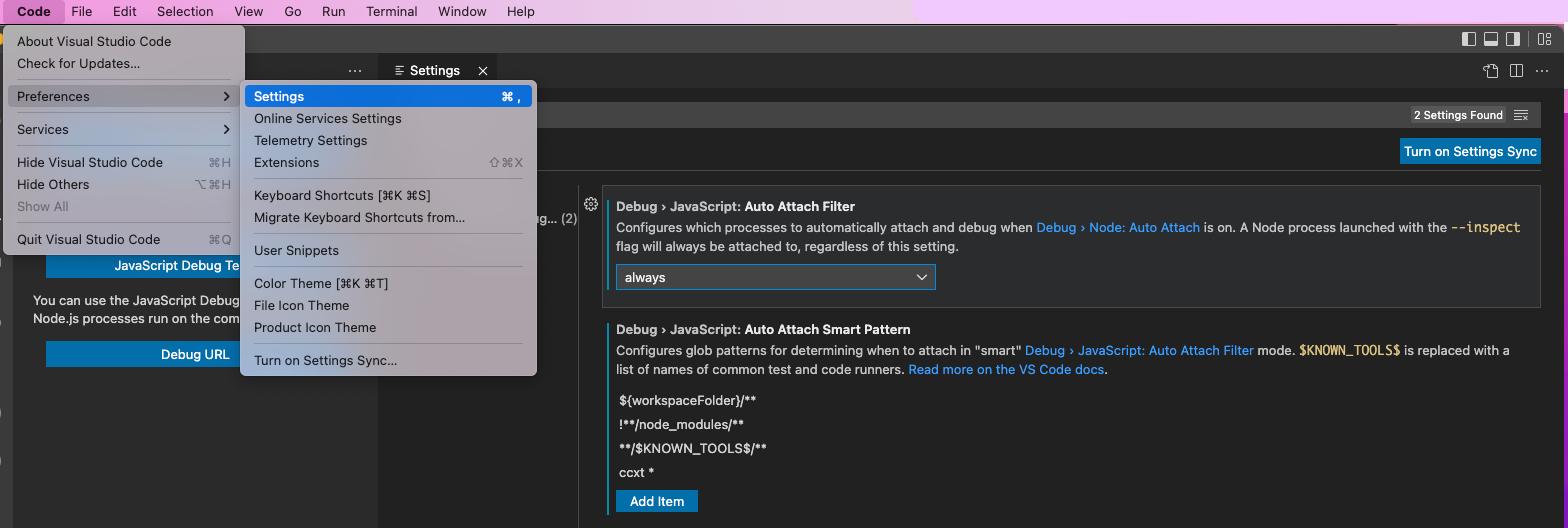
As you can see in image auto attach is set to always so whenever a node process is started it will automatically attach debugger to it. Change this setting according to your requirement.
There will be 4 option, one of it will be disable which will disable the auto attach feature so debugger will not automatically attached when you run your node process. You can read more about auto attach here.
Configure it according to your needs.

开发云社区提供前沿行业资讯和优质的学习知识,同时提供优质稳定、价格优惠的云主机、数据库、网络、云储存等云服务产品
更多推荐
 0
0 0
0- 0


 已为社区贡献4438条内容

所有评论(0)