


Grafana (Unified) Alerting allows you to learn about problems in your systems moments after they occur. It's a new alerting mechanism built into Grafana so that alerting and observability can be carried out at one sacred place. It also doesn't have any dependency over Alertmanager.
Since it's a new alerting system, there are few caveats to pass. One of the major is how does my alert look like when it's sent.
The scope of this article is to get started with Grafana alerting & templating the messages so that they can be easier to read.
Prerequisite:
- Fundamental understanding of Grafana alerting
- Grafana (local) / Grafana Cloud.
Create Slack contact point
A contact point tells Grafana where to send the alert, for example Slack, Email etc. Let's see how to set up for slack :
- Create a slack incoming webhook by following the official doc.
2. Create a new contact point at your-grafana.com/alerting/notifications.
3. You only need to fill in 3 fields there and save it :
- contact type :
Slack - name :
Slack - webhook URL :
above copied webhook
4. Finally, to test it out, you can click on the Test button on your Slack contact point :

Alert creation in Grafana
From the above steps, we created a Slack contact point and sent a test message to our Slack channel.
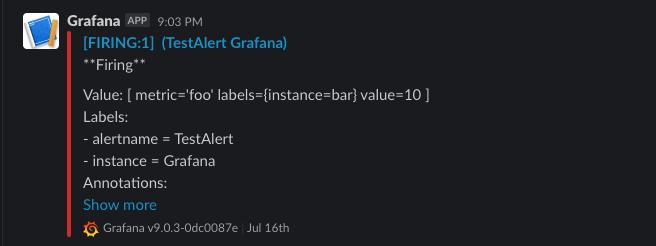
By default, if you click on test, this is how the test alert looks on your slack :
For simplicity, let's say we want to get alerted if the memory usage of the server goes above 50%.
The query for that is : node_memory_MemAvailable_bytes / node_memory_MemTotal_bytes * 100 < 50
Let's create an alert in Grafana :
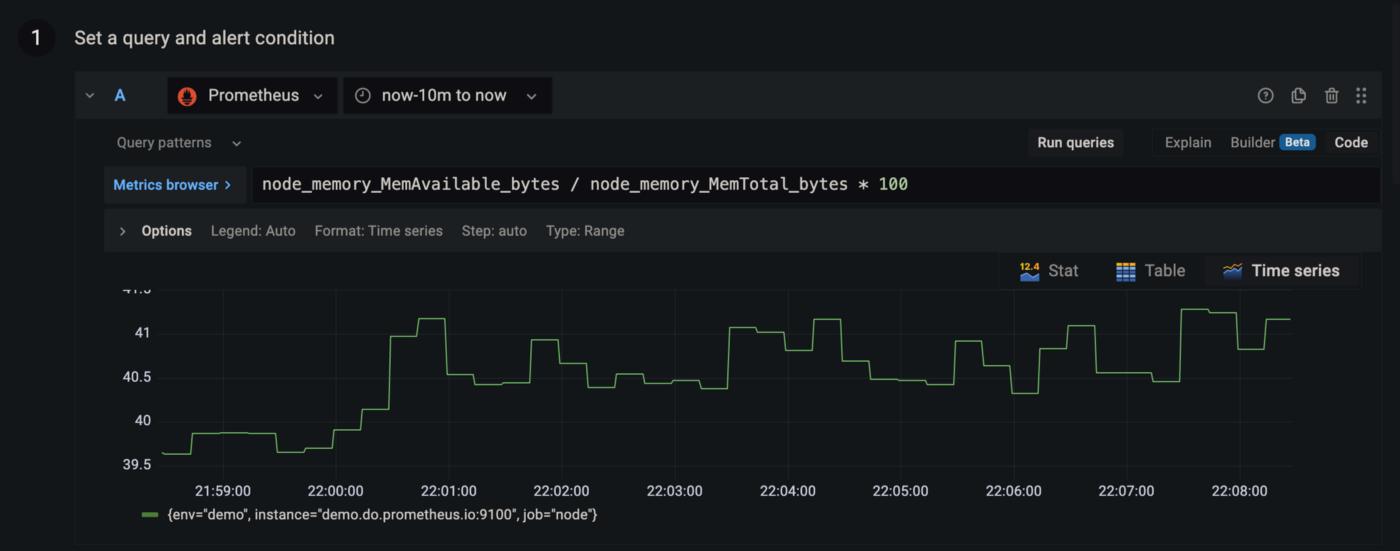
The first part A (above) is the query section.
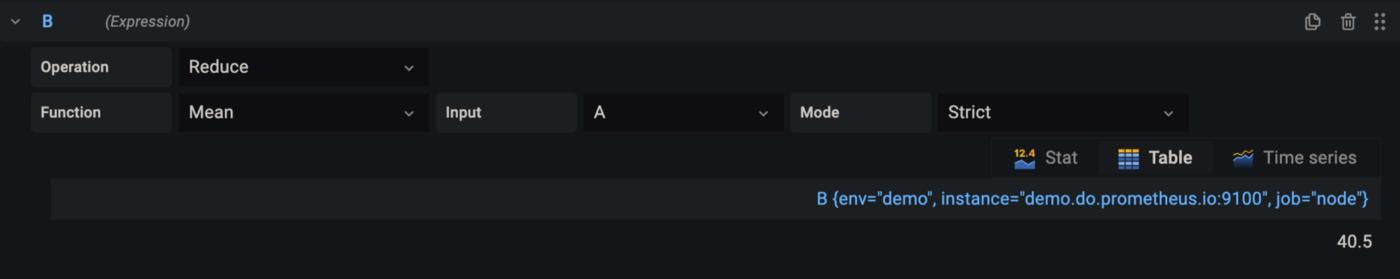
In next part B, we’re using the reduce operation to get the mean value of the above query to average out the result (useful if you’re monitoring multiple machines).
Further, we’ll use Math operation to evaluate alerting criteria. In this case, I need to get alerted if the memory usage (percentage value) is less than 50%.
Hence, I’ll use the expression $B < 50.
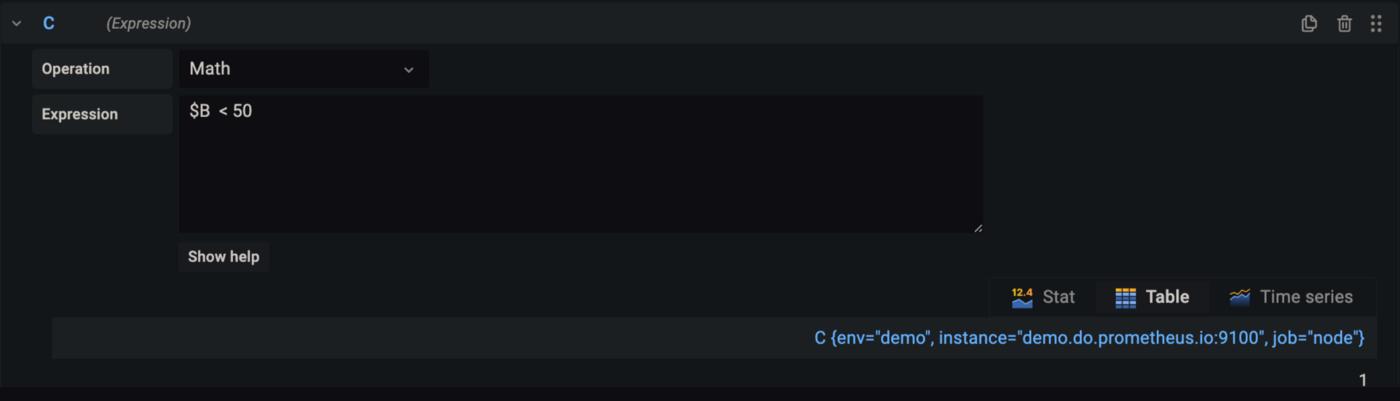
As you can see from my above screenshot, the resulted value is 1, that means the query value satisfies my specified condition (true) and hence I’ll get alerted. Similarly, 0 means not satisfied with the condition and no alerts will be fired.
Since the available memory is around 40% which is less than 50 what we mentioned in the part B we got the value of 1 which is true.
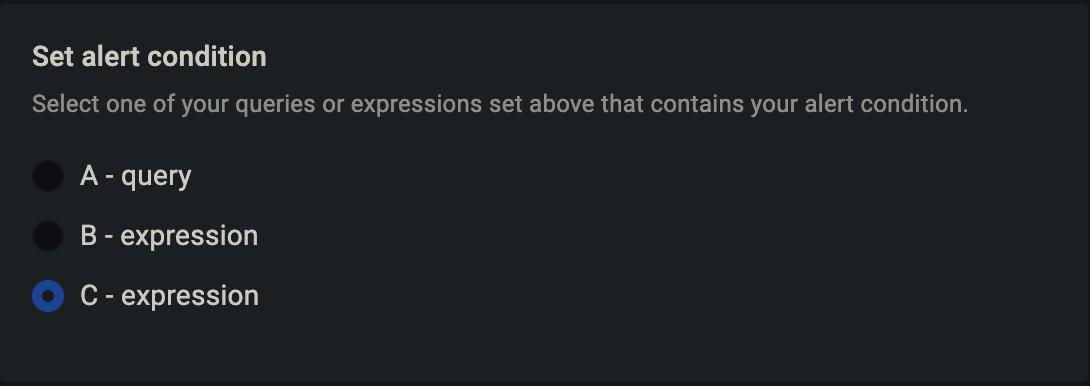
Finally, we’ll say on which expression (A, B & C) alerting needs to set. Here, I’ll select C.
In Add details for your alert section, let's name the alert NodeHighMemoryUsage.
Let's add a Summary section to our alert with value : Memory left on the instance is below 50%.
Now, let’s add a Description with the below value :
Only {{ humanize $values.B.Value }} % memory is left on node {{ $labels.instance }}.
I’ve used humanize the function so that the percentage value can be rounded off to 2 decimals. Otherwise, by default Grafana will display Decimal values up to 10 i.e., the percentage value will be 39.12345675477% which is not easily readable.
In order to get the percentage value in my alert, I’ve used $values.B.Value.
$valuesrefers to the value of each expression step.- Since in our case, the percentage value gets resulted in expression B. Hence
$values.B. - I’ve added one more
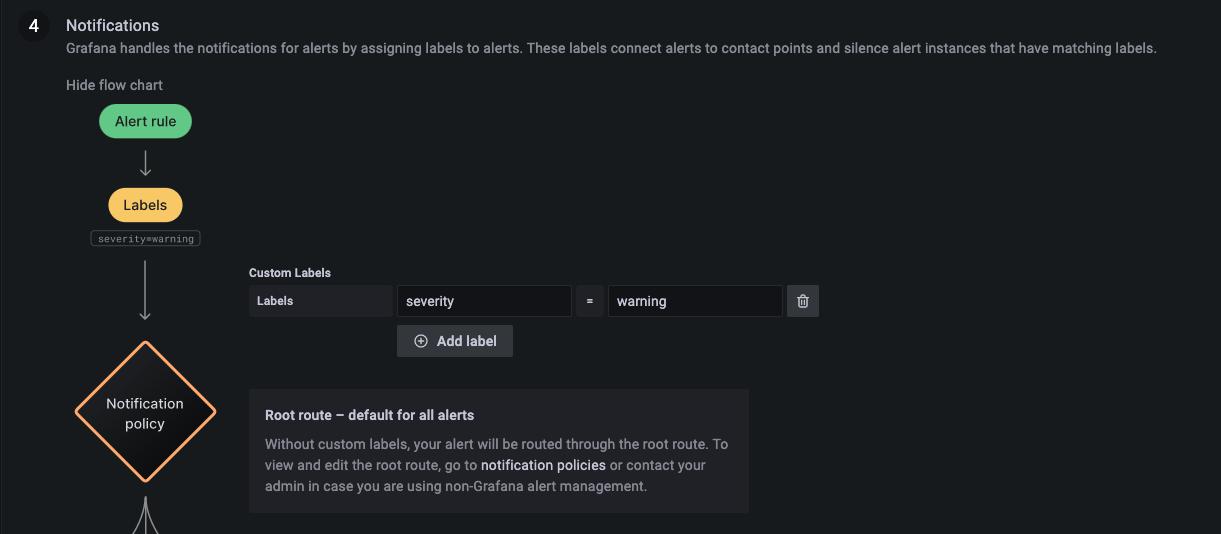
Valueto at the end, that’s because$valuesis a map. - Also, let's add a label to this alert to classify what’s the severity of this alert, we’ll classify this as warning and save the alert.
Message Templating
Wait for a few minutes for the alert to trigger, and your Slack message should look similar to this:
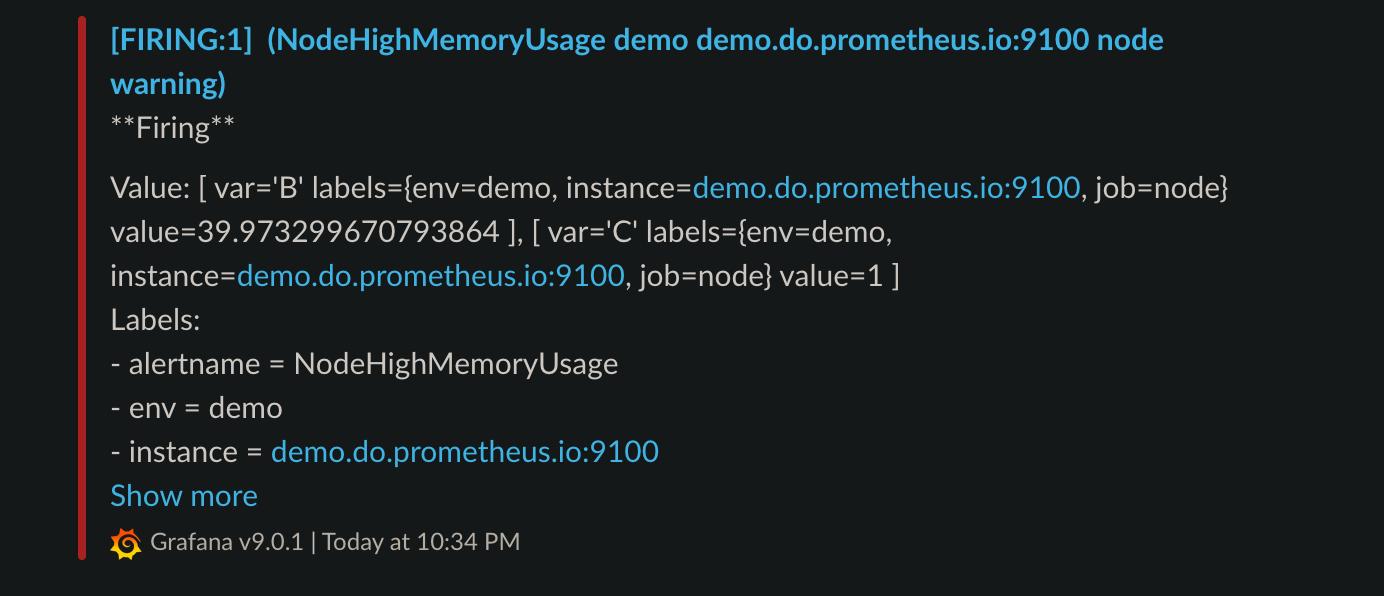
It's difficult to make sense of this for anyone. We got tons of unneeded labels, the percentage value is readable only by robots. Overall, it's not visually appealing.
We are going to fix that using templates :
- Go to contact points → select
new templateand name it asslack
These templates are basically Alertmanager templates (format)and are structured using Go language.
2. Let's define a template function which will display slack emoji based on severity.
{{ define "alert_severity_prefix_emoji" -}}
{{- end -}}
3. Now, let’s add the emoji based on 2 severity critical & warning inside the above defined template :
{{ define "alert_severity_prefix_emoji" -}}
	{{- if ne .Status "firing" -}}
		:white_check_mark:
	{{- else if eq .CommonLabels.severity "critical" -}}
		:red_circle:
	{{- else if eq .CommonLabels.severity "warning" -}}
		:warning:
	{{- end -}}
{{- end -}}
In the above function, we’re defining :
- If the alert status is not firing, then the emoji will be ✅
- If the severity is critical, then emoji will be 🔴
- If the severity is warning, then the emoji will be ⚠️
If you’re wondering how do I know that the severity of a label will be available under CommonLabels, All the labels which are available to use are mentioned in Templating Data doc.
Now, let's create the title template which will define how does our alert title should look like.
First we’ll create an empty template function similar to above :
{{ define "slack.title" -}}
{{- end -}}
Let's add the below content inside that :
{{ define "slack.title" -}}
	{{ template "__alert_severity_prefix_emoji" . }}
	[{{- .Status | toUpper -}}{{- if eq .Status "firing" }} x {{ .Alerts.Firing | len -}}{{- end }}  | {{ .CommonLabels.env | toUpper -}} ] ||  {{ .CommonLabels.alertname -}}
{{- end -}}
To get more understanding of what’s happening above :
- In the first line, we’re inserting the emoji template which we defined in the previous step.
- Next, we’re changing the status of the alert (e.g., Resolved / Firing) to upper case using
toUpperfunction. - If the status of the alert is
firingthen calculate & display how many times the alert has been firing usinglenfunction. - Embed the environment label (if it exists) which is used to distinguish alerts between separate environments like staging & production.
- And finally display the alert name.
Let's define one last template function, which will be used to display the message body :
{{- define "slack.text" -}}
{{- range .Alerts -}}
{{ if gt (len .Annotations) 0 }}
*Summary*: {{ .Annotations.summary}}
*Description*: {{ .Annotations.description }}
Labels:
{{ range .Labels.SortedPairs }} {{ if or (eq .Name "env") (eq .Name "instance") }} *{{ .Name }}*: `{{ .Value }}`
{{ end }}{{ end }}
{{ end }}
{{ end }}
{{ end }}
- From the above function, we’re displaying two fields in our message body which will be
SummaryandDescriptionwhich we defined earlier in alerting onAnnotationssection. - Hence, we’re checking if that annotation fields exist, if yes, display them.
- At the end, we’re displaying the Labels which will help better categorize the alerts.
- I’m looping through the Labels available from the alerts using
rangefunction and displaying the Label name and value if the name of the label is (in this case)envandinstance. - I.e. Using
iffunction, we’re displaying only 2 labels by specifying the label’s name. - If you want to display multiple label’s you can add more section in the
ifsection. - This helps in filtering out few unneeded labels from being displayed.
Finally, your complete template should look like :
Now, edit the contact point slack and scroll down and select the option Optional Slack settings.
- In the Title, enter the below to specify the template to use:
{{ template "slack.alert_title" . }}
- In the Text Body, enter the below :
{{ template "slack.text" . }}
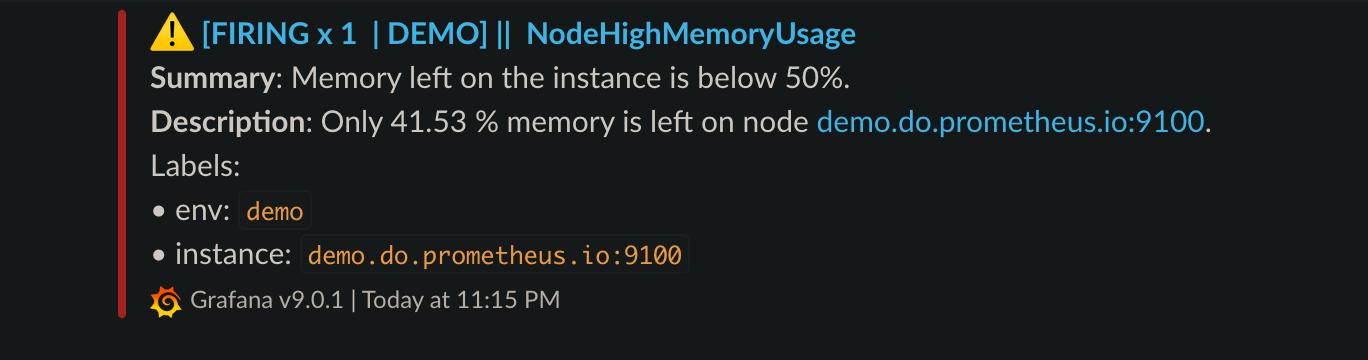
- Save it and finally your Slack message now should look minimalistic like below :
References :
- https://grafana.com/docs/grafana/latest/alerting/fundamentals/annotation-label/variables-label-annotation/
- https://github.com/grafana/grafana/issues/37393
- https://grafana.com/docs/grafana/latest/alerting/fundamentals/annotation-label/example-template-functions/


 已为社区贡献13070条内容

所有评论(0)