

The Data Engineering Process of Music Streaming
It is one thing to build an application that works and attracts millions of users; It is another to figure out why your app is a success, what makes it so attractive, and how to maintain, and even grow that level of trust from your app users.
Engineering streams of data collected from app users almost every second is a task major streaming companies have to take on in order to monitor activities, and in the long run, make better business decisions based on the results revealed after cleaning and querying these data. This write-up attempts to explain the data engineering process of the Streamify project carried out on github by thetimoye.
The Project — Streamify
Eventsim is a simulated song streaming application that runs on docker and produces at least a million user streams per day. This application depicts perfectly user behaviour on music streaming applications, hence, proves suitable to be engineered as a real-life application.
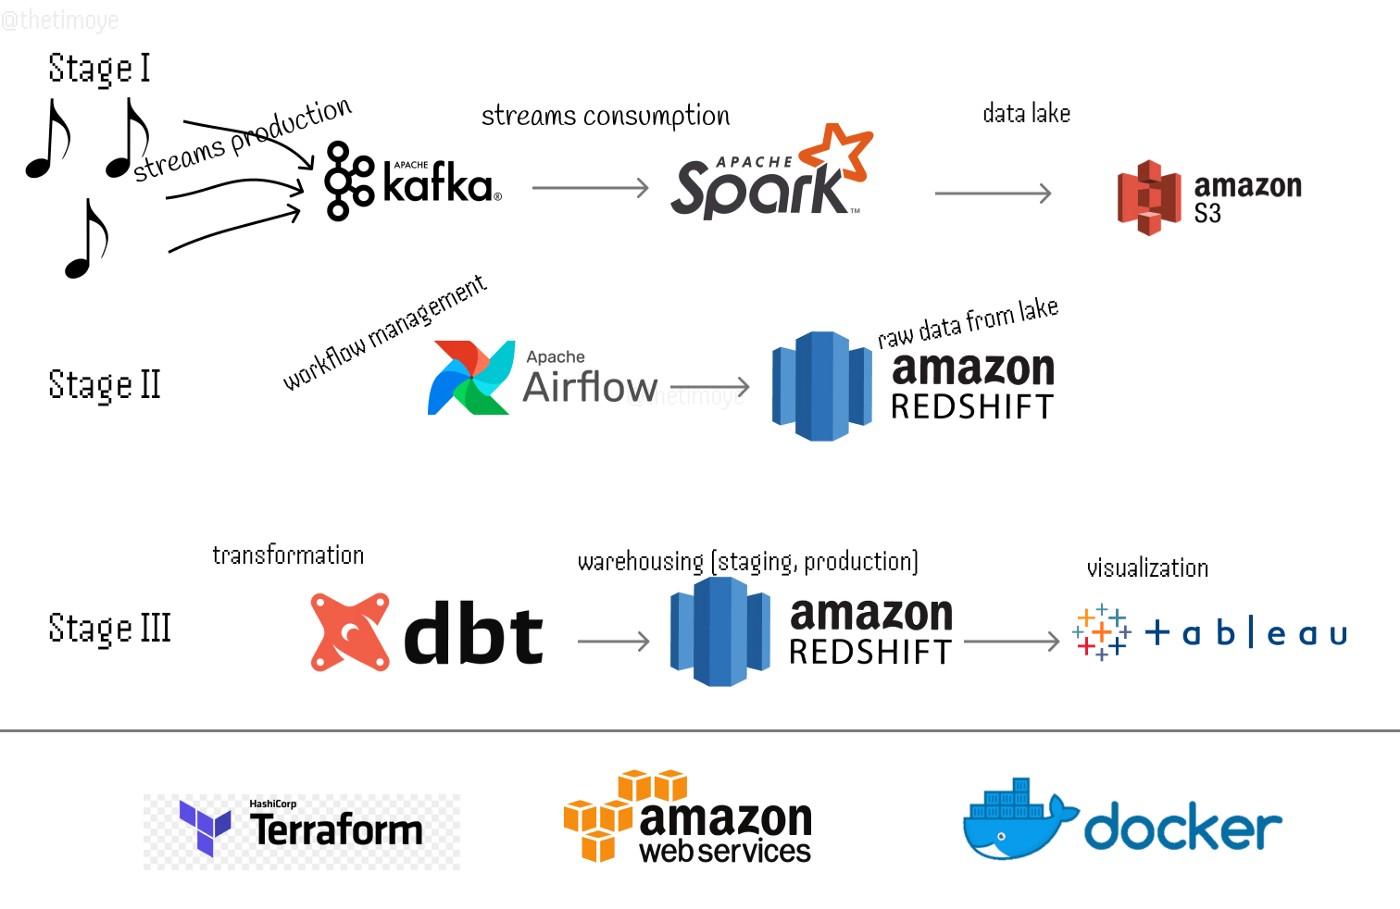
Stage I: Production, Consumption, and Loading
Each stream of data is produced into kafka as a message in a topic, divided into three topics, consumed and processed by Spark Streaming, and then written into a data lake — AWS S3 — in two formats: the raw format — as is consumed by spark straight in to the lake without any processing done along the line, and the clean format — read and processed which involves some data cleaning processes like renaming columns, replacing null values (replacement so no data is lost), enforcing a schema (using proper datatypes), encoding and decoding strings, and expanding granularity (e.g. extraction of months, minutes & seconds from timestamps). Each format still maintaining the topics their messages belong.
Below are a sample of a message consumed by Spark belonging to the page_view topic, and the adopted schema after cleaning.
Raw Data:
”{\”ts\”:1653763440000,\”sessionId\”:432505,\”page\”:\”NextSong\”,\”auth\”:\”Logged In\”,\”method\”:\”PUT\”,\”status\”:200,\”level\”:\”free\”,\”itemInSession\”:3,\”city\”:\”Tampa\”,\”zip\”:\”33637\”,\”state\”:\”FL\”,\”userAgent\”:\”\\\”Mozilla/5.0 (Macintosh; Intel Mac OS X 10_9_4) AppleWebKit/537.78.2 (KHTML, like Gecko) Version/7.0.6 Safari/537.78.2\\\”\”,\”lon\”:-82.361113,\”lat\”:28.045334,\”userId\”:432506,\”lastName\”:\”Perez\”,\”firstName\”:\”Noelle\”,\”gender\”:\”F\”,\”registration\”:1495975266000,\”artist\”:\”Joanna Connor\”,\”song\”:\”Playing In The Dirt\”,\”duration\”:238.39302}”
Clean Schema:
root
 |-- timestamp: string (nullable = false)
 |-- session_id: long (nullable = false)
 |-- page: string (nullable = false)
 |-- auth: string (nullable = false)
 |-- method: string (nullable = false)
 |-- status: integer (nullable = false)
 |-- level: string (nullable = false)
 |-- item_in_session: integer (nullable = false)
 |-- city: string (nullable = false)
 |-- zip: integer (nullable = false)
 |-- state: string (nullable = false)
 |-- user_agent: string (nullable = false)
 |-- longitude: double (nullable = false)
 |-- latitude: double (nullable = false)
 |-- user_id: integer (nullable = false)
 |-- last_name: string (nullable = false)
 |-- first_name: string (nullable = false)
 |-- gender: string (nullable = false)
 |-- registration: long (nullable = false)
 |-- artist: string (nullable = false)
 |-- song: string (nullable = false)
 |-- duration: double (nullable = false)
 |-- __year: integer (nullable = false)
 |-- year: integer (nullable = true)
 |-- month: integer (nullable = true)
 |-- abs_date: timestamp (nullable = true)
 |-- __month: integer (nullable = true)
 |-- hour: integer (nullable = true)
 |-- day: integer (nullable = true)
 |-- day_of_week: integer (nullable = true)
`|-- is_weekend: boolean (nullable = true)
Lake Structure:
bucket_name:
__:raw
____:listen_events
____:page_view_events
____:auth_events
__:clean
____:listen_events
____:page_view_events
____:auth_events
In S3, each topic is partitioned by the year and month of the event, since queries are run based on occurrence of events.
Stage II: Scheduling and Warehousing
In order to have these events in the warehouse as soon as they are consumed and processed, scheduling has to be involved. With all of Airflow’s properties and its readily available Python API, it proved to be the best choice of tool for workflow management.
Loading these data in a warehouse involved two Dags: Creating a database, a schema, and tables which is run once and once only, and loading the data from S3 to Redshift, scheduled to run every 15 minutes. This gives room for complete processing of each stream by Spark and transfer of the data to the lake (and some time in case of network latency).
An initial dev schema is created in the Streamify database which houses the three topics (as retrieved from the lake). This will stand as the warehouse’s one source of truth as manipulations will begin to take place as data is transformed and transferred to the staging and production tables.
Stage 3: Modelling, Transformation and Loading
Shipping data after transformation within the same warehouse could be achieved by writing python and SQL scripts and creating Airflow Dags. But, other data professionals like data analysts could have need to query the data different from what is already provided; in one place, with ease and controlled versions. Which is why DBT comes in handy.
The first step to data transformation into a warehouse is determining the tables that will be present in resulting schema, and what form they should take. Since there’s one major action of emphasis carried out by the users of this application, the Star Schema data modelling approach will be adopted, with a flat structure so that all dimensions tables will be directly linked to the fact table avoiding so many joins.
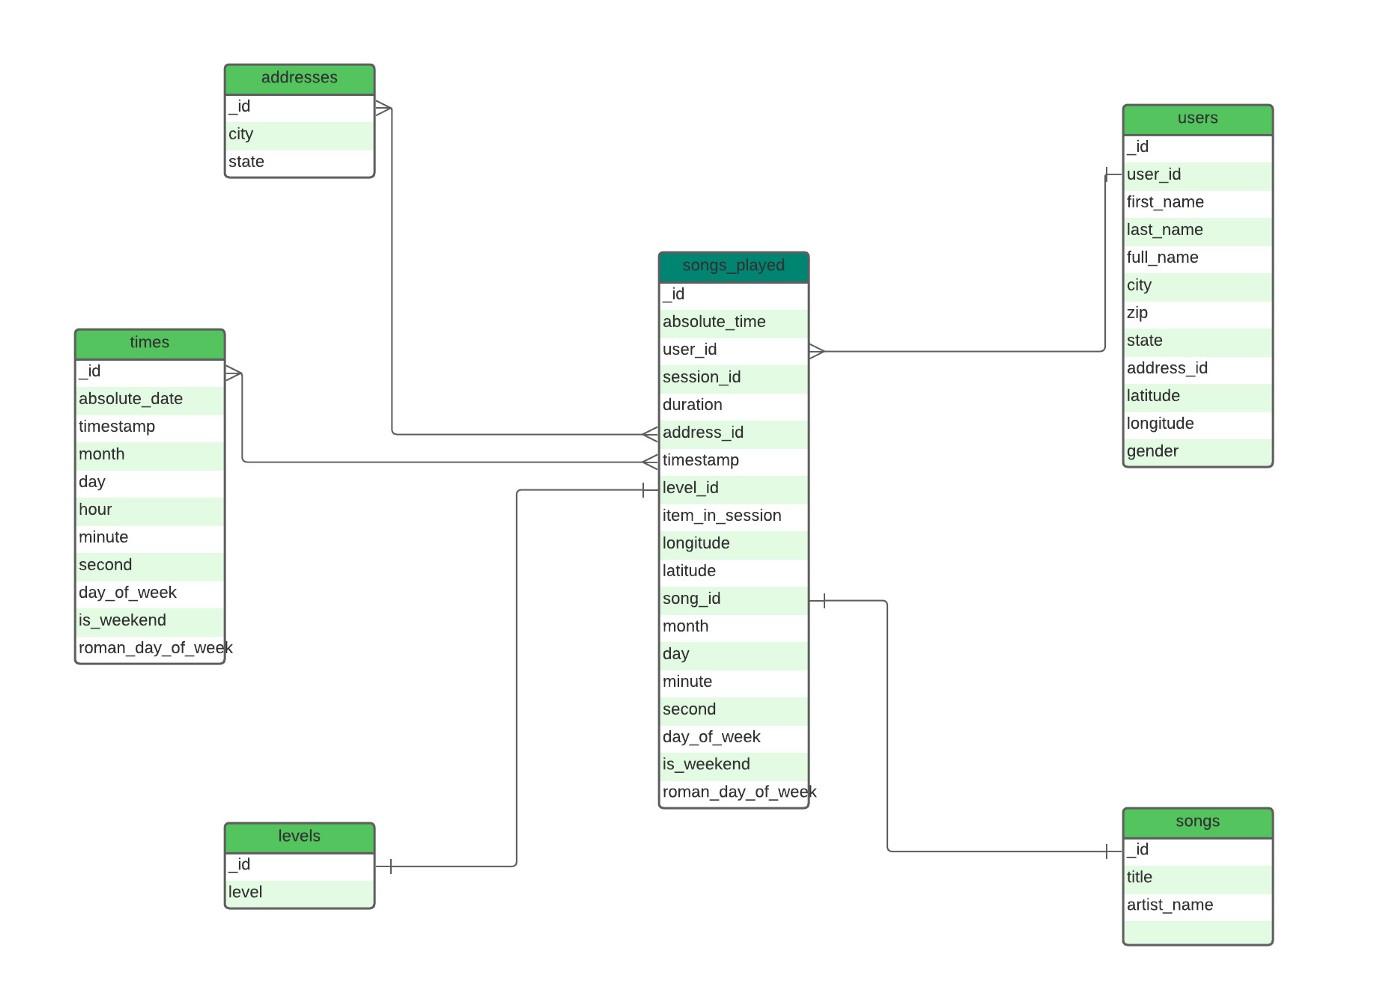
Each table as shown in the figure above is created and loaded into the Staging schema, ready to be shipped to production and queried.
The staging and production areas are majorly similar in structure. They both contain cleaned and transformed data. But the production area is where groupings and aggregations are performed, and the final query is achieved. For example, you can decide how to separate a particular set of missing values from the others, and still have these data available in the same table.
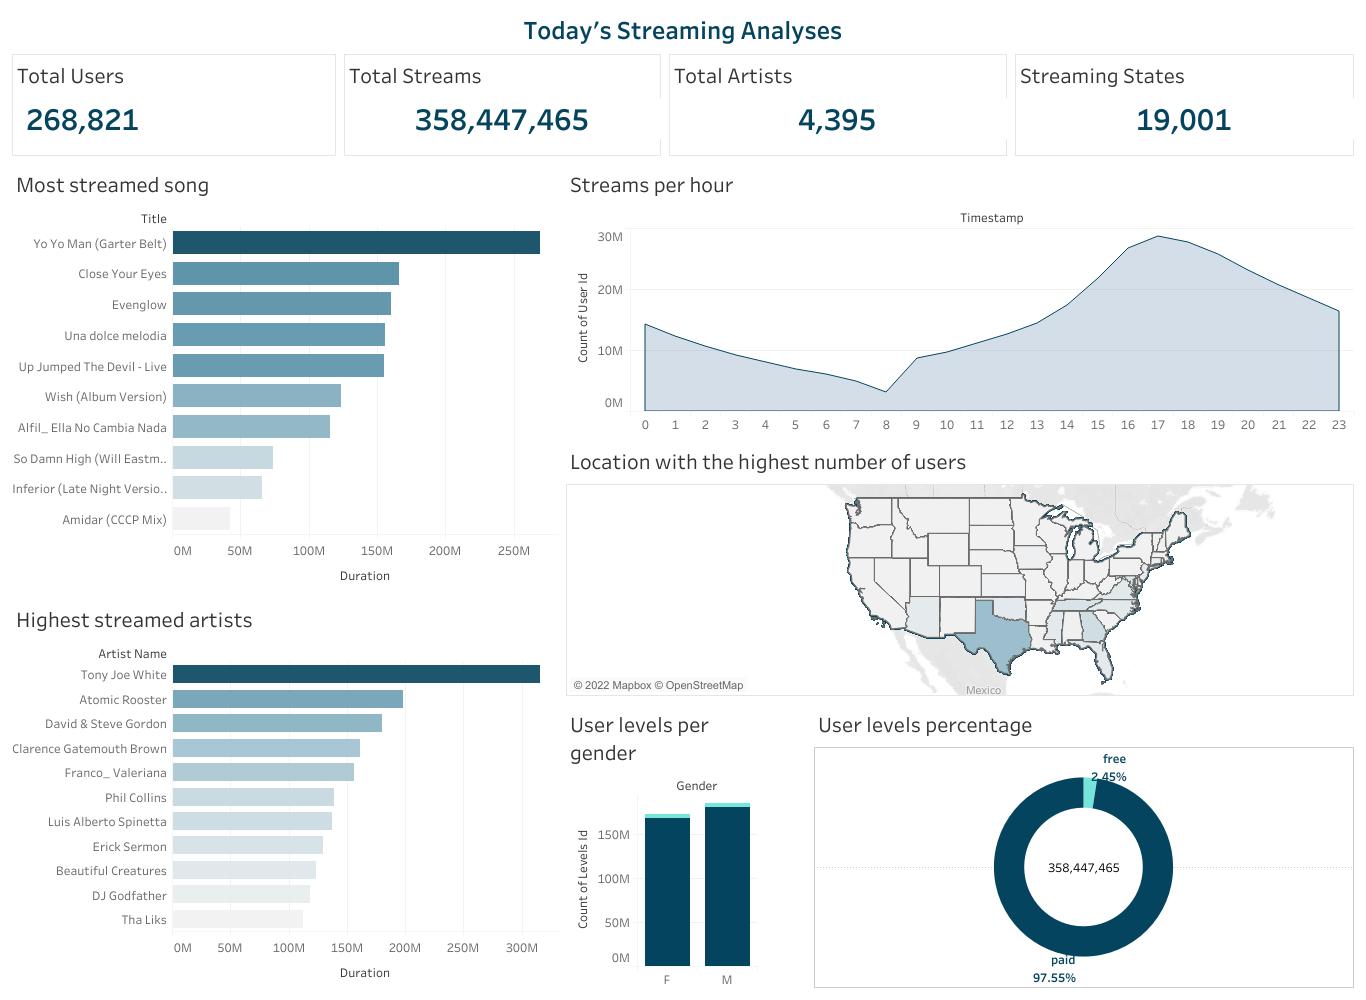
Finally, after all engineering processes are completed, the events carried out on the Streamify application can finally be visualised and analysed. Enabling experts make business decisions that will help developers know their users, and deliver to them better services based on user behaviour.


 已为社区贡献20427条内容

所有评论(0)