
YouPlot : 用于 Unicode 绘图的命令行工具
你好 DEV.to 我最近创建了一个名为 YouPlot 的命令行工具。使用此工具,您可以在终端上绘制 unicode 图。这篇文章与 README 相同。祝你一切顺利。 https://github.com/kojix2/youplot YouPlot 是一个命令行工具,用于处理来自标准流的数据的 Unicode 绘图。 📊 由UnicodePlot提供支持 安装 gem install yo
你好 DEV.to
我最近创建了一个名为 YouPlot 的命令行工具。使用此工具,您可以在终端上绘制 unicode 图。这篇文章与 README 相同。祝你一切顺利。
https://github.com/kojix2/youplot
YouPlot 是一个命令行工具,用于处理来自标准流的数据的 Unicode 绘图。
📊 由UnicodePlot提供支持
安装
gem install youplot
进入全屏模式 退出全屏模式
快速入门
cat data.tsv | uplot <command> [options]
条形图
curl -sL https://git.io/ISLANDScsv \
| sort -nk2 -t, \
| tail -n15 \
| uplot bar -d, -t "Areas of the World's Major Landmasses"
进入全屏模式 退出全屏模式
[ ](https://res.cloudinary.com/practicaldev/image/fetch/s--IBdaJdPz--/c_limit%2Cf_auto%2Cfl_progressive%2Cq_auto%2Cw_880/https://user-images.githubusercontent .com/5798442/101999903-d36a2d00-3d24-11eb-9361-b89116f44122.png)
直方图
echo -e "from numpy import random;" \
        "n = random.randn(10000);"  \
        "print('\\\n'.join(str(i) for i in n))" \
| python \
| uplot hist --nbins 20
进入全屏模式 退出全屏模式
[ ](https://res.cloudinary.com/practicaldev/image/fetch/s--2irBPDiS--/c_limit%2Cf_auto%2Cfl_progressive%2Cq_auto%2Cw_880/https://user-images.githubusercontent .com/5798442/101999820-21cafc00-3d24-11eb-86db-e410d19b07df.png)
线图
curl -sL https://git.io/AirPassengers \
| cut -f2,3 -d, \
| uplot line -d, -w 50 -h 15 -t AirPassengers --xlim 1950,1960 --ylim 0,600
进入全屏模式 退出全屏模式
[ ](https://res.cloudinary.com/practicaldev/image/fetch/s--86awVhyq--/c_limit%2Cf_auto%2Cfl_progressive%2Cq_auto%2Cw_880/https://user-images.githubusercontent .com/5798442/101999825-24c5ec80-3d24-11eb-99f4-c642e8d221bc.png)
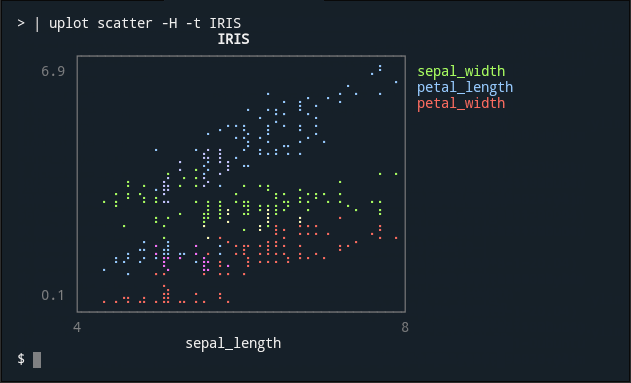
散点
curl -sL https://git.io/IRIStsv \
| cut -f1-4 \
| uplot scatter -H -t IRIS
进入全屏模式 退出全屏模式
[ ](https://res.cloudinary.com/practicaldev/image/fetch/s--wQU2CxYY--/c_limit%2Cf_auto%2Cfl_progressive%2Cq_auto%2Cw_880/https://user-images.githubusercontent .com/5798442/101999827-27284680-3d24-11eb-9903-551857eaa69c.png)
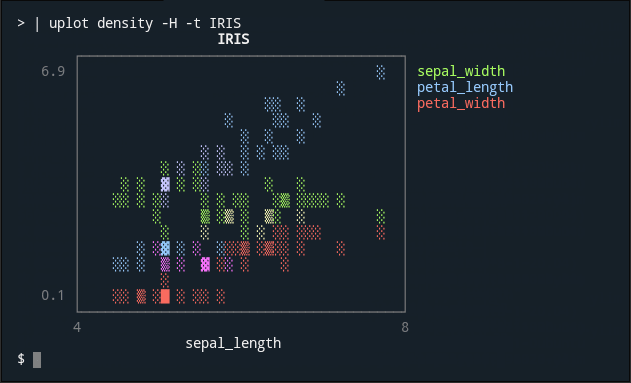
密度
curl -sL https://git.io/IRIStsv \
| cut -f1-4 \
| uplot density -H -t IRIS
进入全屏模式 退出全屏模式
[ ](https://res.cloudinary.com/practicaldev/image/fetch/s--e2UEcwEP--/c_limit%2Cf_auto%2Cfl_progressive%2Cq_auto%2Cw_880/https://user-images.githubusercontent .com/5798442/101999828-2abbcd80-3d24-11eb-902c-2f44266fa6ae.png)
箱线图
curl -sL https://git.io/IRIStsv \
| cut -f1-4 \
| uplot boxplot -H -t IRIS
进入全屏模式 退出全屏模式
[ ](https://res.cloudinary.com/practicaldev/image/fetch/s--rIdGr6nt--/c_limit%2Cf_auto%2Cfl_progressive%2Cq_auto%2Cw_880/https://user-images.githubusercontent .com/5798442/101999830-2e4f5480-3d24-11eb-8891-728c18bf5b35.png)
计数
在此示例中,YouPlot 从人类基因注释文件中计算基因所在的染色体数并创建条形图。人类基因注释文件可以从以下网站下载。
- https://www.gencodegenes.org/human/
cat gencode.v35.annotation.gff3 \
| grep -v '#' | grep 'gene' | cut -f1 | \
 uplot count -t "The number of human gene annotations per chromosome"  -c blue
进入全屏模式 退出全屏模式
[ ](https://res.cloudinary.com/practicaldev/image/fetch/s--VtqBIt8---/c_limit%2Cf_auto%2Cfl_progressive%2Cq_auto%2Cw_880/https://user-images. githubusercontent.com/5798442/101999832-30b1ae80-3d24-11eb-96fe-e5000bed1f5c.png)
注意:count不是很快,因为它在 Ruby 脚本中运行。
如果数据很小,即在大多数情况下,这很好。但是,如果您想可视化庞大的数据,使用如下所示的常见 Unix 命令组合会更快。
cat gencode.v35.annotation.gff3 | grep -v '#' | grep 'gene' | cut -f1 \
|sort | uniq -c | sort -nrk2 | awk '{print $2,$1}' \
| uplot bar -d ' ' -t "The number of human gene annotations per chromosome"  -c blue
进入全屏模式 退出全屏模式
用途
为什么选择 YouPlot?
运行 R、Python、Julia、gnuplot 或任何 REPL 来检查数据会不会有点痛苦?
YouPlot 是用于此目的的命令行工具。使用 YouPlot,您可以在不离开终端和外壳的情况下继续工作。
YouPlot怎么用?
uplot是youplot的缩写形式。您可以使用其中任何一个。
- 从标准输入读取数据
*cat data.tsv | uplot <command> [options]
- 从文件中读取数据
*uplot <command> [options] data.tsv ...
- 将数据从标准输入输出到标准输出
*pipeline1 | uplot <command> -O | pipeline2
在哪里输出绘图?
默认情况下,绘图输出到标准错误输出。
可以使用-o选项指定绘图的输出文件或流。
输入数据在哪里输出?
默认情况下,输入数据不会在任何地方输出。
不带参数的-O选项将输入数据直接输出到标准输出。这在将数据传递到后续管道时很有用。
有哪些类型的地块可用?
以下子命令可用
命令
短的
这个怎么运作
条形图
酒吧
绘制水平条形图
直方图
历史
绘制水平直方图
线图
线
绘制折线图
线图
线条
绘制具有多个系列的折线图
分散
s
绘制散点图
密度
d
绘制密度图
箱形图
盒子
绘制水平箱线图
请参阅count的快速入门。
命令
短的
这个怎么运作
数数
C
根据出现次数绘制baplot(慢)
如何查看详细的命令行选项
使用--help打印特定于命令的选项。
uplot hist --help
Usage: uplot histogram [options] <in.tsv>

Options for histogram:
        --symbol VAL         character to be used to plot the bars
        --closed VAL
    -n, --nbins VAL          approximate number of bins

Options:
...
进入全屏模式 退出全屏模式
如何查看可用颜色列表?
uplot colors
进入全屏模式 退出全屏模式
贡献
-
报告错误
-
修复错误和提交拉取请求
-
编写、澄清或修复文档
-
建议或添加新功能
发展
git clone https://github.com/your_name/GR.rb # Clone the Git repo
cd GR.rb
bundle install             # Install the gem dependencies
bundle exec rake test      # Run the test
bundle exec rake install   # Installation from source code
进入全屏模式 退出全屏模式
执照
我的许可证。

华为、百度、京东云现已入驻,来创建你的专属开发者社区吧!
更多推荐
 0
0 0
0- 0


 已为社区贡献20434条内容

所有评论(0)