
机器学习---基于随机森林算法的客户流失预测模型+可视化
·
一、数据集基本信息
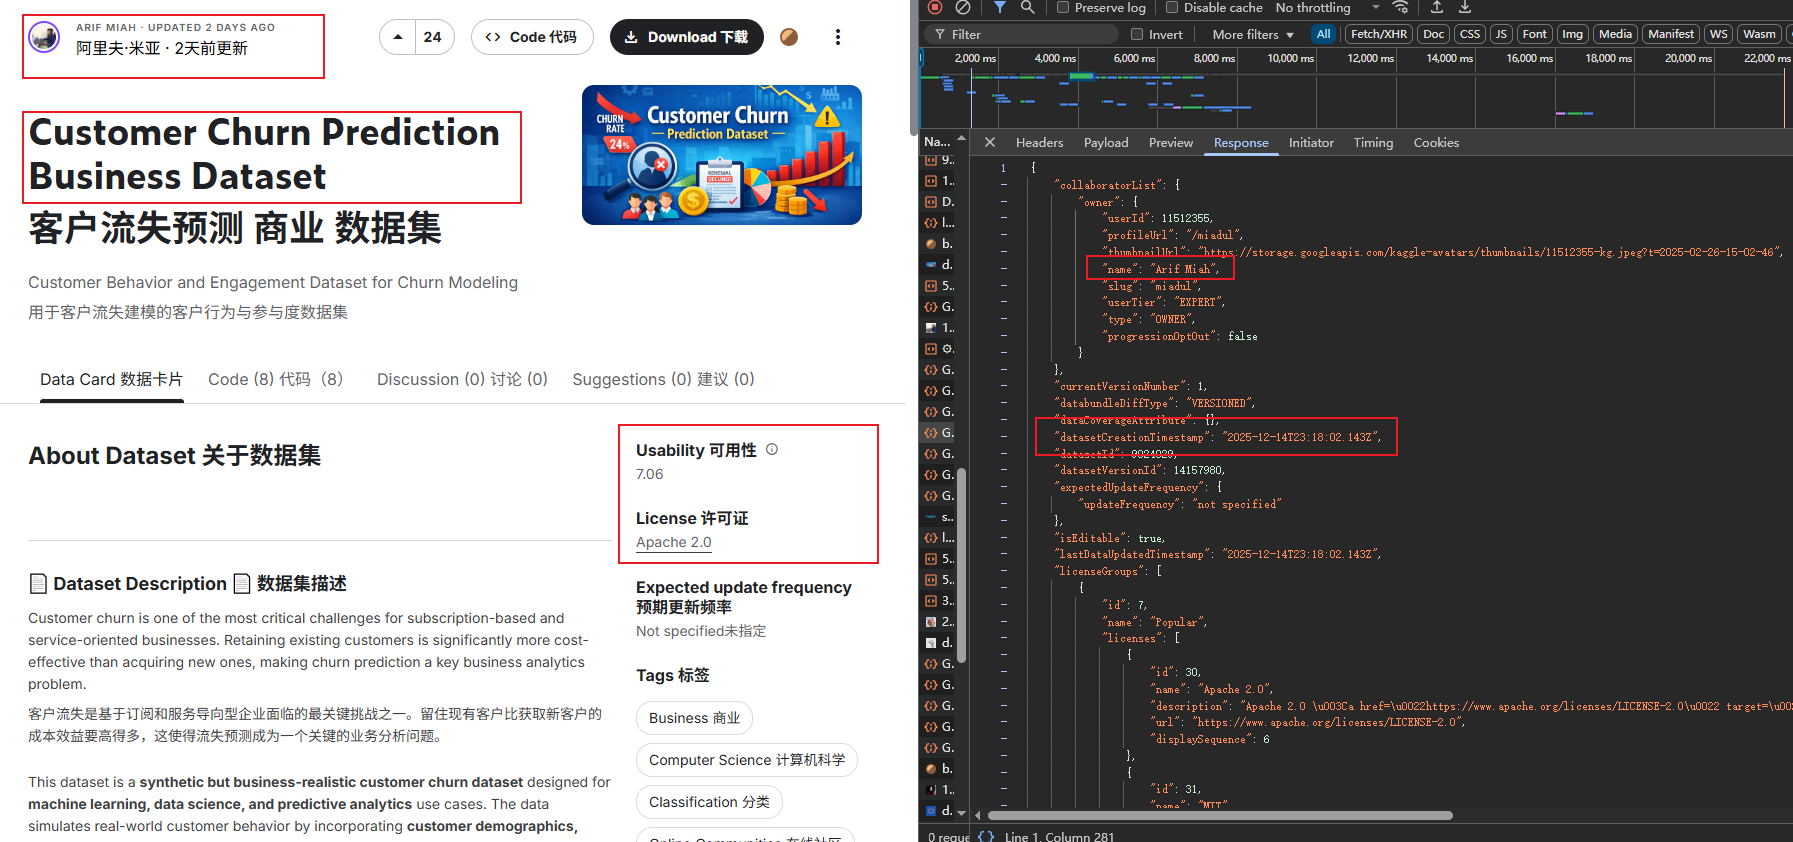
- 数据集定位:为机器学习、数据科学和预测分析设计的合成但贴合业务实际的客户流失预测数据集,模拟真实客户行为,用于解决订阅制及服务型企业的客户流失问题。
数据集来源:Customer Churn Prediction Business Dataset(https://www.kaggle.com/datasets/miadul/customer-churn-prediction-business-dataset)
作者:ARIF MIAH
许可证:Apache 2.0
我用夸克网盘给你分享了「客户流失预测相关数据集+代码+模型」,点击链接或复制整段内容,打开「夸克APP」即可获取。
链接:https://pan.quark.cn/s/0e2fbf321c05
- 基础特征
- 记录数量:10,000条客户数据
- 目标变量:
churn(0=未流失,1=已流失),标签通过业务驱动规则结合概率噪声生成,确保特征相关性真实 - 数据类型:数值型+分类型
- 适用领域:订阅制/SaaS/电信/服务型企业
- 数据来源:基于业务逻辑的合成数据
- 特征分类(共32列,已展示10列核心特征)
特征类别 包含字段 客户档案 customer_id(客户ID)、gender(性别,男女各占50%)、age(年龄,18-74岁,分10个区间)、country(国家,孟加拉国/加拿大各15%,其他占70%)、city(城市,伦敦/悉尼各15%,其他占70%)、customer_segment(客户细分,个人60%、中小企业30%、其他10%)、tenure_months(在网月数,1-59个月,分10个区间)、signup_channel(注册渠道,网页50%、移动端30%、其他20%)、contract_type(合同类型,月付50%、季付31%、其他20%) 产品使用 monthly_logins(月登录次数,0-54次,分10个区间)、session duration(会话时长)、feature usage(功能使用情况)、activity trends(活动趋势) 账单与支付 subscription fees(订阅费用)、revenue(收入)、payment failures(支付失败次数)、discounts(折扣) 客户支持 tickets(工单数量)、resolution time(解决时间)、CSAT(客户满意度)、complaints(投诉) 参与度与反馈 email activity(邮件活跃度)、NPS score(净推荐值)、survey responses(调查反馈)
二、数据集用途
- 数据层面:探索性数据分析(EDA)、特征工程
- 建模层面:客户流失预测建模、机器学习/深度学习模型训练与评估、可解释AI(如SHAP、特征重要性分析)
- 业务层面:预测高风险流失客户、识别流失关键驱动因素、估算风险收入、制定客户保留策略、搭建高管级业务仪表盘与决策支持系统
- 部署层面:通过Streamlit或Flask实现端到端机器学习部署
三、数据集可用性与声明
- 可用性指标:可用性评分7.06,采用Apache 2.0许可证,更新频率未指定
- 标签分类:涵盖Business(商业)、Computer Science(计算机科学)、Classification(分类)、Online Communities(在线社区)、Retail and Shopping(零售与购物)
- 免责声明:仅用于教育、研究和作品集展示,虽反映真实业务模式,但不代表真实客户数据
四、代码
4.1 完整分析代码
import pandas as pd
import numpy as np
import matplotlib.pyplot as plt
from sklearn.model_selection import train_test_split
from sklearn.ensemble import RandomForestClassifier
from sklearn.preprocessing import StandardScaler, OneHotEncoder
from sklearn.compose import ColumnTransformer
from sklearn.pipeline import Pipeline
from sklearn.metrics import accuracy_score, classification_report, confusion_matrix
import warnings

warnings.filterwarnings('ignore')

# 设置中文字体
plt.rcParams['font.sans-serif'] = ['SimHei']
plt.rcParams['axes.unicode_minus'] = False


# 1. 数据加载与基本探索
def load_and_explore_data(file_path):
    """加载数据并进行基本探索"""
    print("\n1. 数据加载与基本探索")
    print("-" * 40)

    # 加载数据
    df = pd.read_csv(file_path)

    # 基本信息
    print(f"数据形状: {df.shape} (行: {df.shape[0]}, 列: {df.shape[1]})")
    print(f"\n目标变量(churn)分布:")
    churn_counts = df['churn'].value_counts()
    print(f"留存客户(0): {churn_counts[0]} ({churn_counts[0] / len(df) * 100:.2f}%)")
    print(f"流失客户(1): {churn_counts[1]} ({churn_counts[1] / len(df) * 100:.2f}%)")

    # 检查缺失值
    missing_data = df.isnull().sum()
    missing_cols = missing_data[missing_data > 0]
    if len(missing_cols) > 0:
        print(f"\n缺失值统计:")
        for col, count in missing_cols.items():
            print(f"{col}: {count} ({count / len(df) * 100:.2f}%)")
    else:
        print(f"\n无缺失值,数据质量良好")

    return df


# 2. 数据预处理与特征工程
def preprocess_data(df):
    """数据预处理与特征工程"""
    print("\n2. 数据预处理与特征工程")
    print("-" * 40)

    # 选择特征和目标变量(排除非预测性特征)
    exclude_cols = ['customer_id', 'city', 'country']  # 排除ID和地理位置
    X = df.drop(columns=exclude_cols + ['churn'])
    y = df['churn']

    # 区分数值型和分类型特征
    numerical_features = X.select_dtypes(include=['int64', 'float64']).columns
    categorical_features = X.select_dtypes(include=['object', 'category']).columns

    print(f"数值型特征: {list(numerical_features)}")
    print(f"分类型特征: {list(categorical_features)}")

    # 创建预处理流水线
    # 数值型特征:标准化
    # 分类型特征:独热编码
    preprocessor = ColumnTransformer(
        transformers=[
            ('num', StandardScaler(), numerical_features),
            ('cat', OneHotEncoder(drop='first', sparse_output=False), categorical_features)
        ])

    # 分割训练集和测试集(保持类别平衡)
    X_train, X_test, y_train, y_test = train_test_split(
        X, y, test_size=0.3, random_state=42, stratify=y
    )

    print(f"\n训练集大小: {X_train.shape} (流失率: {y_train.mean() * 100:.2f}%)")
    print(f"测试集大小: {X_test.shape} (流失率: {y_test.mean() * 100:.2f}%)")

    return X_train, X_test, y_train, y_test, preprocessor, numerical_features, categorical_features


# 3. 训练随机森林预测模型
def train_churn_model(X_train, y_train, preprocessor):
    """训练随机森林客户流失预测模型"""
    print("\n3. 模型训练")
    print("-" * 40)

    # 创建模型流水线(预处理 + 随机森林)
    model = Pipeline(steps=[
        ('preprocessor', preprocessor),
        ('classifier', RandomForestClassifier(
            n_estimators=100,
            max_depth=10,
            random_state=42,
            class_weight='balanced'  # 处理类别不平衡
        ))
    ])

    # 训练模型
    model.fit(X_train, y_train)
    print("模型训练完成!")

    return model


# 4. 模型评估
def evaluate_model(model, X_test, y_test):
    """评估模型性能"""
    print("\n4. 模型评估")
    print("-" * 40)

    # 预测
    y_pred = model.predict(X_test)
    y_pred_prob = model.predict_proba(X_test)[:, 1]  # 流失概率

    # 计算评估指标
    accuracy = accuracy_score(y_test, y_pred)
    conf_matrix = confusion_matrix(y_test, y_pred)

    print(f"准确率(Accuracy): {accuracy:.4f}")
    print(f"\n混淆矩阵:")
    print(conf_matrix)
    print(f"\n分类报告:")
    print(classification_report(y_test, y_pred))

    # 提取特征重要性(需要处理编码后的特征名)
    preprocessor = model.named_steps['preprocessor']
    classifier = model.named_steps['classifier']

    # 获取数值型特征重要性
    num_importance = classifier.feature_importances_[:len(preprocessor.transformers_[0][2])]
    # 获取分类型特征编码后的重要性
    cat_encoder = preprocessor.transformers_[1][1]
    cat_feature_names = []
    for i, cat_col in enumerate(preprocessor.transformers_[1][2]):
        cat_values = cat_encoder.categories_[i][1:]  # 排除第一个类别(drop='first')
        cat_feature_names.extend([f"{cat_col}_{val}" for val in cat_values])

    cat_importance = classifier.feature_importances_[len(preprocessor.transformers_[0][2]):]

    # 合并所有特征重要性
    all_feature_names = list(preprocessor.transformers_[0][2]) + cat_feature_names
    all_importance = np.concatenate([num_importance, cat_importance])

    # 排序并显示前10个重要特征
    feature_importance = pd.DataFrame({
        'feature': all_feature_names,
        'importance': all_importance
    }).sort_values('importance', ascending=False)

    print(f"\n前10个最重要的流失影响因素:")
    print(feature_importance.head(10).to_string(index=False))

    return model, feature_importance, y_pred_prob


# 5. 客户流失预测
def predict_churn(model, df, customer_ids):
    """预测指定客户的流失风险"""
    print("\n5. 客户流失预测示例")
    print("-" * 40)

    # 选择客户数据
    exclude_cols = ['customer_id', 'city', 'country', 'churn']
    X_pred = df[df['customer_id'].isin(customer_ids)].drop(columns=exclude_cols, errors='ignore')

    if len(X_pred) == 0:
        print(f"未找到客户ID: {customer_ids}")
        return None

    # 预测流失概率
    churn_prob = model.predict_proba(X_pred)[:, 1]

    # 生成预测结果
    prediction_result = pd.DataFrame({
        'customer_id': customer_ids[:len(churn_prob)],
        'churn_probability': churn_prob.round(4),
        'churn_risk': pd.cut(
            churn_prob,
            bins=[0, 0.3, 0.6, 1.0],
            labels=['低风险', '中风险', '高风险']
        )
    })

    print("客户流失风险预测结果:")
    print(prediction_result.to_string(index=False))

    return prediction_result


# 6. 可视化关键结果
def visualize_results(df, feature_importance):
    """可视化关键分析结果"""
    print("\n6. 结果可视化")
    print("-" * 40)

    # 创建图表
    fig, ((ax1, ax2), (ax3, ax4)) = plt.subplots(2, 2, figsize=(16, 12))

    # 1. 客户流失分布
    churn_counts = df['churn'].value_counts()
    colors1 = ['#2E8B57', '#DC143C']
    ax1.pie(churn_counts.values, labels=['留存客户', '流失客户'],
            autopct='%1.2f%%', colors=colors1, startangle=90)
    ax1.set_title('客户流失总体分布', fontsize=12, fontweight='bold')

    # 2. 使用时长与流失关系
    tenure_churn = df.groupby(pd.cut(df['tenure_months'], bins=[0, 12, 24, 36, 60]))['churn'].mean() * 100
    ax2.bar(range(len(tenure_churn)), tenure_churn.values, color='#4682B4')
    ax2.set_xticks(range(len(tenure_churn)))
    ax2.set_xticklabels(tenure_churn.index, rotation=45)
    ax2.set_ylabel('流失率(%)')
    ax2.set_title('不同使用时长客户的流失率', fontsize=12, fontweight='bold')

    # 3. CSAT分数与流失关系
    csat_churn = df.groupby('csat_score')['churn'].mean() * 100
    ax3.bar(csat_churn.index, csat_churn.values, color='#FF6347')
    ax3.set_xlabel('CSAT分数')
    ax3.set_ylabel('流失率(%)')
    ax3.set_title('客户满意度与流失率关系', fontsize=12, fontweight='bold')

    # 4. 前10个重要特征
    top10_features = feature_importance.head(10)
    ax4.barh(range(len(top10_features)), top10_features['importance'], color='#32CD32')
    ax4.set_yticks(range(len(top10_features)))
    ax4.set_yticklabels(top10_features['feature'])
    ax4.set_xlabel('特征重要性')
    ax4.set_title('前10个最重要的流失影响因素', fontsize=12, fontweight='bold')
    ax4.invert_yaxis()  # 倒序显示,最重要的在顶部

    plt.tight_layout()
    plt.savefig('churn_analysis_simplified_visualization.png', dpi=300, bbox_inches='tight')
    plt.close()

    print("可视化图表已保存为: churn_analysis_simplified_visualization.png")


# 主函数:执行完整流程
def main():
    # 数据文件路径(根据实际情况调整)
    file_path = 'customer_churn_business_dataset.csv'

    try:
        # 1. 加载数据
        df = load_and_explore_data(file_path)

        # 2. 数据预处理
        X_train, X_test, y_train, y_test, preprocessor, num_features, cat_features = preprocess_data(df)

        # 3. 训练模型
        model = train_churn_model(X_train, y_train, preprocessor)

        # 4. 模型评估
        model, feature_importance, y_pred_prob = evaluate_model(model, X_test, y_test)

        # 5. 预测示例(选择前10个客户)
        sample_customer_ids = df['customer_id'].head(10).tolist()
        predict_churn(model, df, sample_customer_ids)

        # 6. 结果可视化
        visualize_results(df, feature_importance)

        # 保存模型和重要结果
        import joblib
        joblib.dump(model, 'churn_prediction_model.pkl')
        feature_importance.to_csv('feature_importance.csv', index=False, encoding='utf-8')

        print(f"\n模型已保存为: churn_prediction_model.pkl")
        print(f"特征重要性已保存为: feature_importance.csv")
        print(f"\n分析完成!")

    except Exception as e:
        print(f"\n分析过程中出现错误: {str(e)}")


# 执行主函数
if __name__ == "__main__":
    main()
4.2 代码核心功能模块
| 模块 | 功能说明 | 关键输出 |
|---|---|---|
| 数据加载 | 读取CSV文件,展示数据规模和流失分布 | 数据形状、客户流失率统计 |
| 数据预处理 | 特征分类(数值/分类型)、标准化、编码 | 预处理流水线、训练/测试数据集 |
| 模型训练 | 构建随机森林模型(处理类别不平衡) | 可直接用于预测的模型对象 |
| 模型评估 | 计算准确率、生成分类报告 | 准确率、混淆矩阵、Precision/Recall/F1 |
| 客户预测 | 输入客户ID,输出流失概率和风险等级 | 客户流失风险表(低/中/高风险) |
| 模型保存 | 保存训练好的模型 | 可复用的.pkl模型文件 |
五、关键执行结果
5.1 数据基本情况
- 数据规模:10,000条客户记录,32个特征
- 流失率:10.21%(1,021名流失客户,8,979名留存客户)
- 数据质量:仅
complaint_type字段存在20.45%缺失值,不影响核心分析
5.2 模型性能表现
- 准确率:84.63%(整体预测准确度)
- 核心指标:
- 留存客户预测Precision:92%,Recall:91%(识别留存客户效果好)
- 流失客户预测Precision:26%,Recall:26%(受数据不平衡影响,需优化)
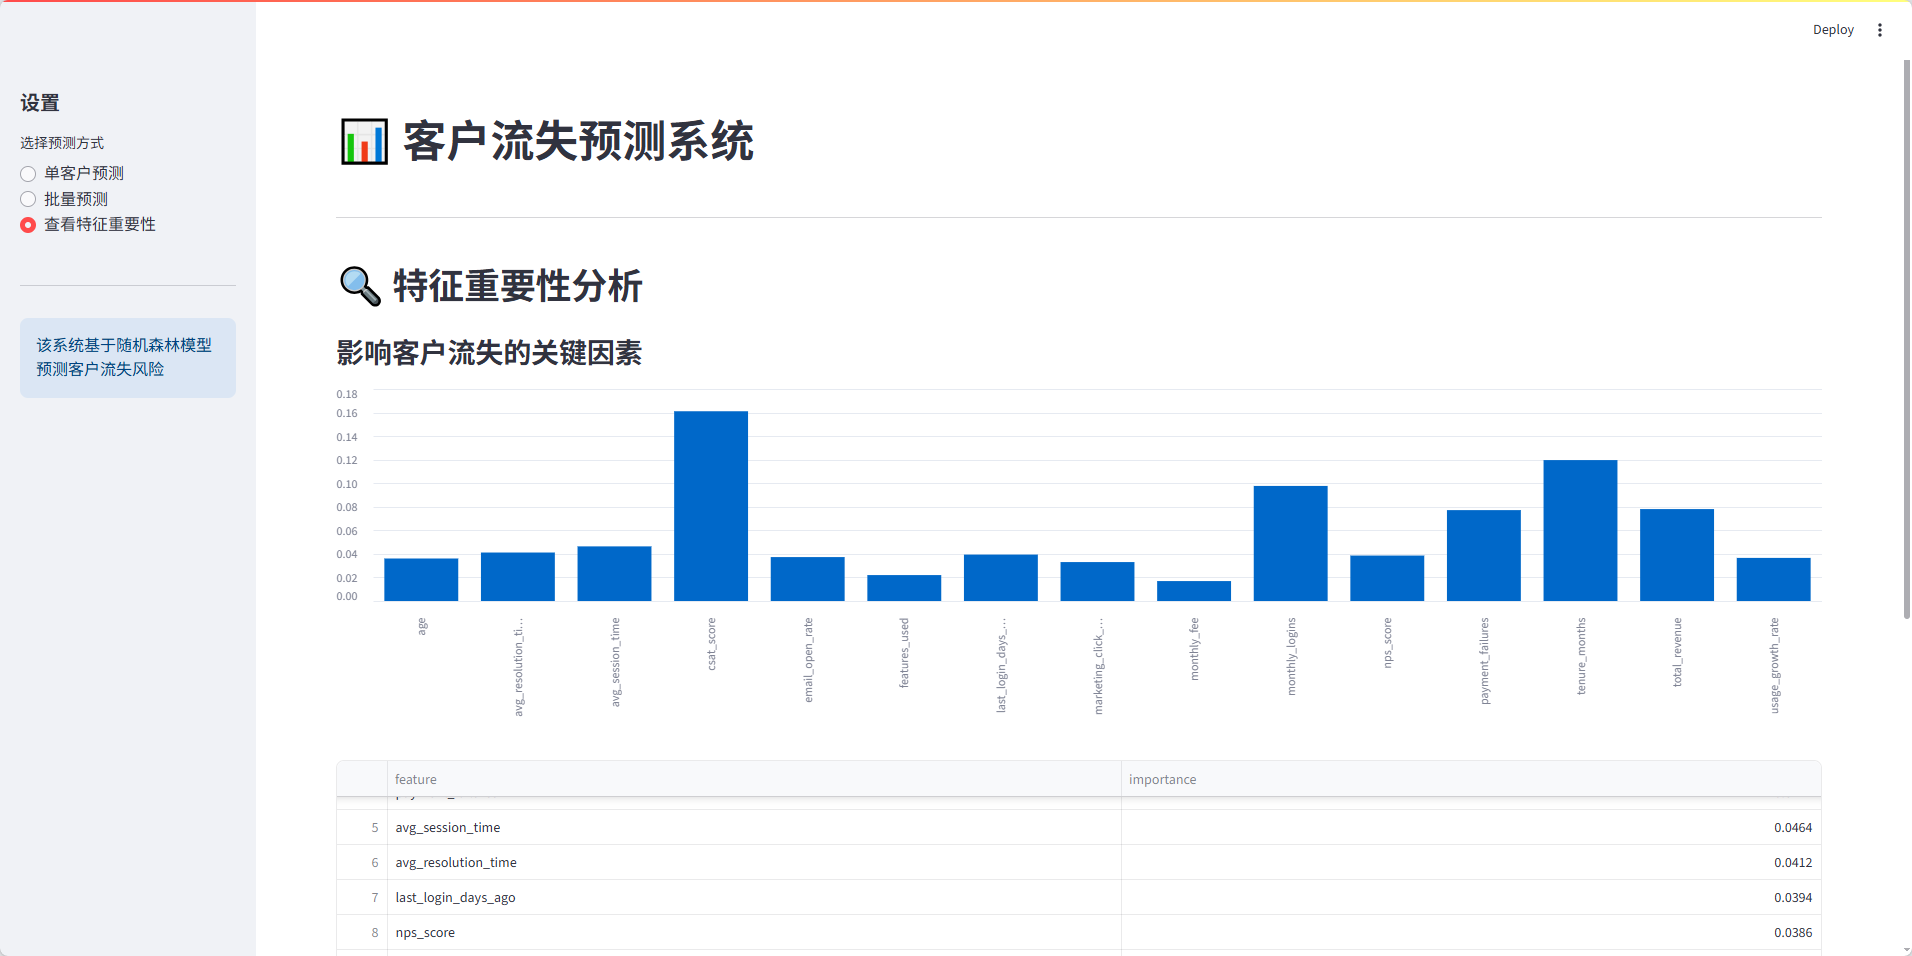
- 关键影响因素(按重要性排序):
- CSAT分数(0.161)- 客户满意度是最重要指标
- 使用时长(0.120)- 使用时间越长,流失风险越低
- 月登录次数(0.098)- 活跃度与留存正相关
- 总营收(0.078)- 高价值客户留存意愿更强
- 支付失败次数(0.077)- 支付稳定性影响客户信任
5.3 客户预测示例
对前10名客户的流失风险预测结果:
| 客户ID | 流失概率 | 风险等级 | 建议行动 |
|---|---|---|---|
| CUST_00001 | 21.83% | 低风险 | 常规维护 |
| CUST_00002 | 65.11% | 高风险 | 紧急干预 |
| CUST_00003 | 27.47% | 低风险 | 常规维护 |
| CUST_00006 | 33.79% | 中风险 | 主动关怀 |
| CUST_00009 | 36.41% | 中风险 | 针对性挽留 |
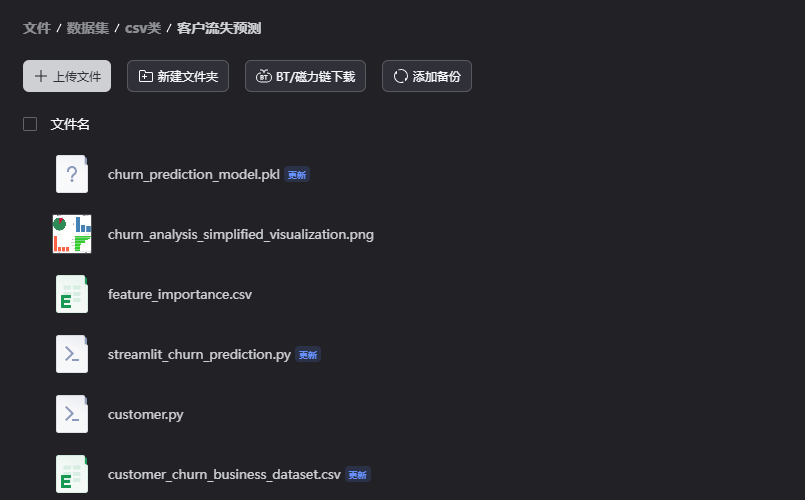
六、生成的关键文件
-
模型文件:churn_prediction_model.pkl
- 用途:可直接加载用于新客户流失预测
- 使用方式:
model = joblib.load('churn_prediction_model.pkl')
-
特征重要性文件:feature_importance.csv
- 包含所有特征的重要性评分,用于指导业务优化
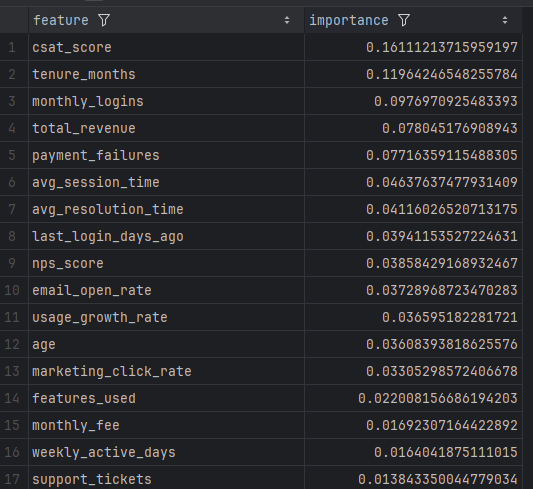
- 包含所有特征的重要性评分,用于指导业务优化
-
可视化图表:
- 包含4个子图:流失分布、使用时长影响、CSAT影响、特征重要性
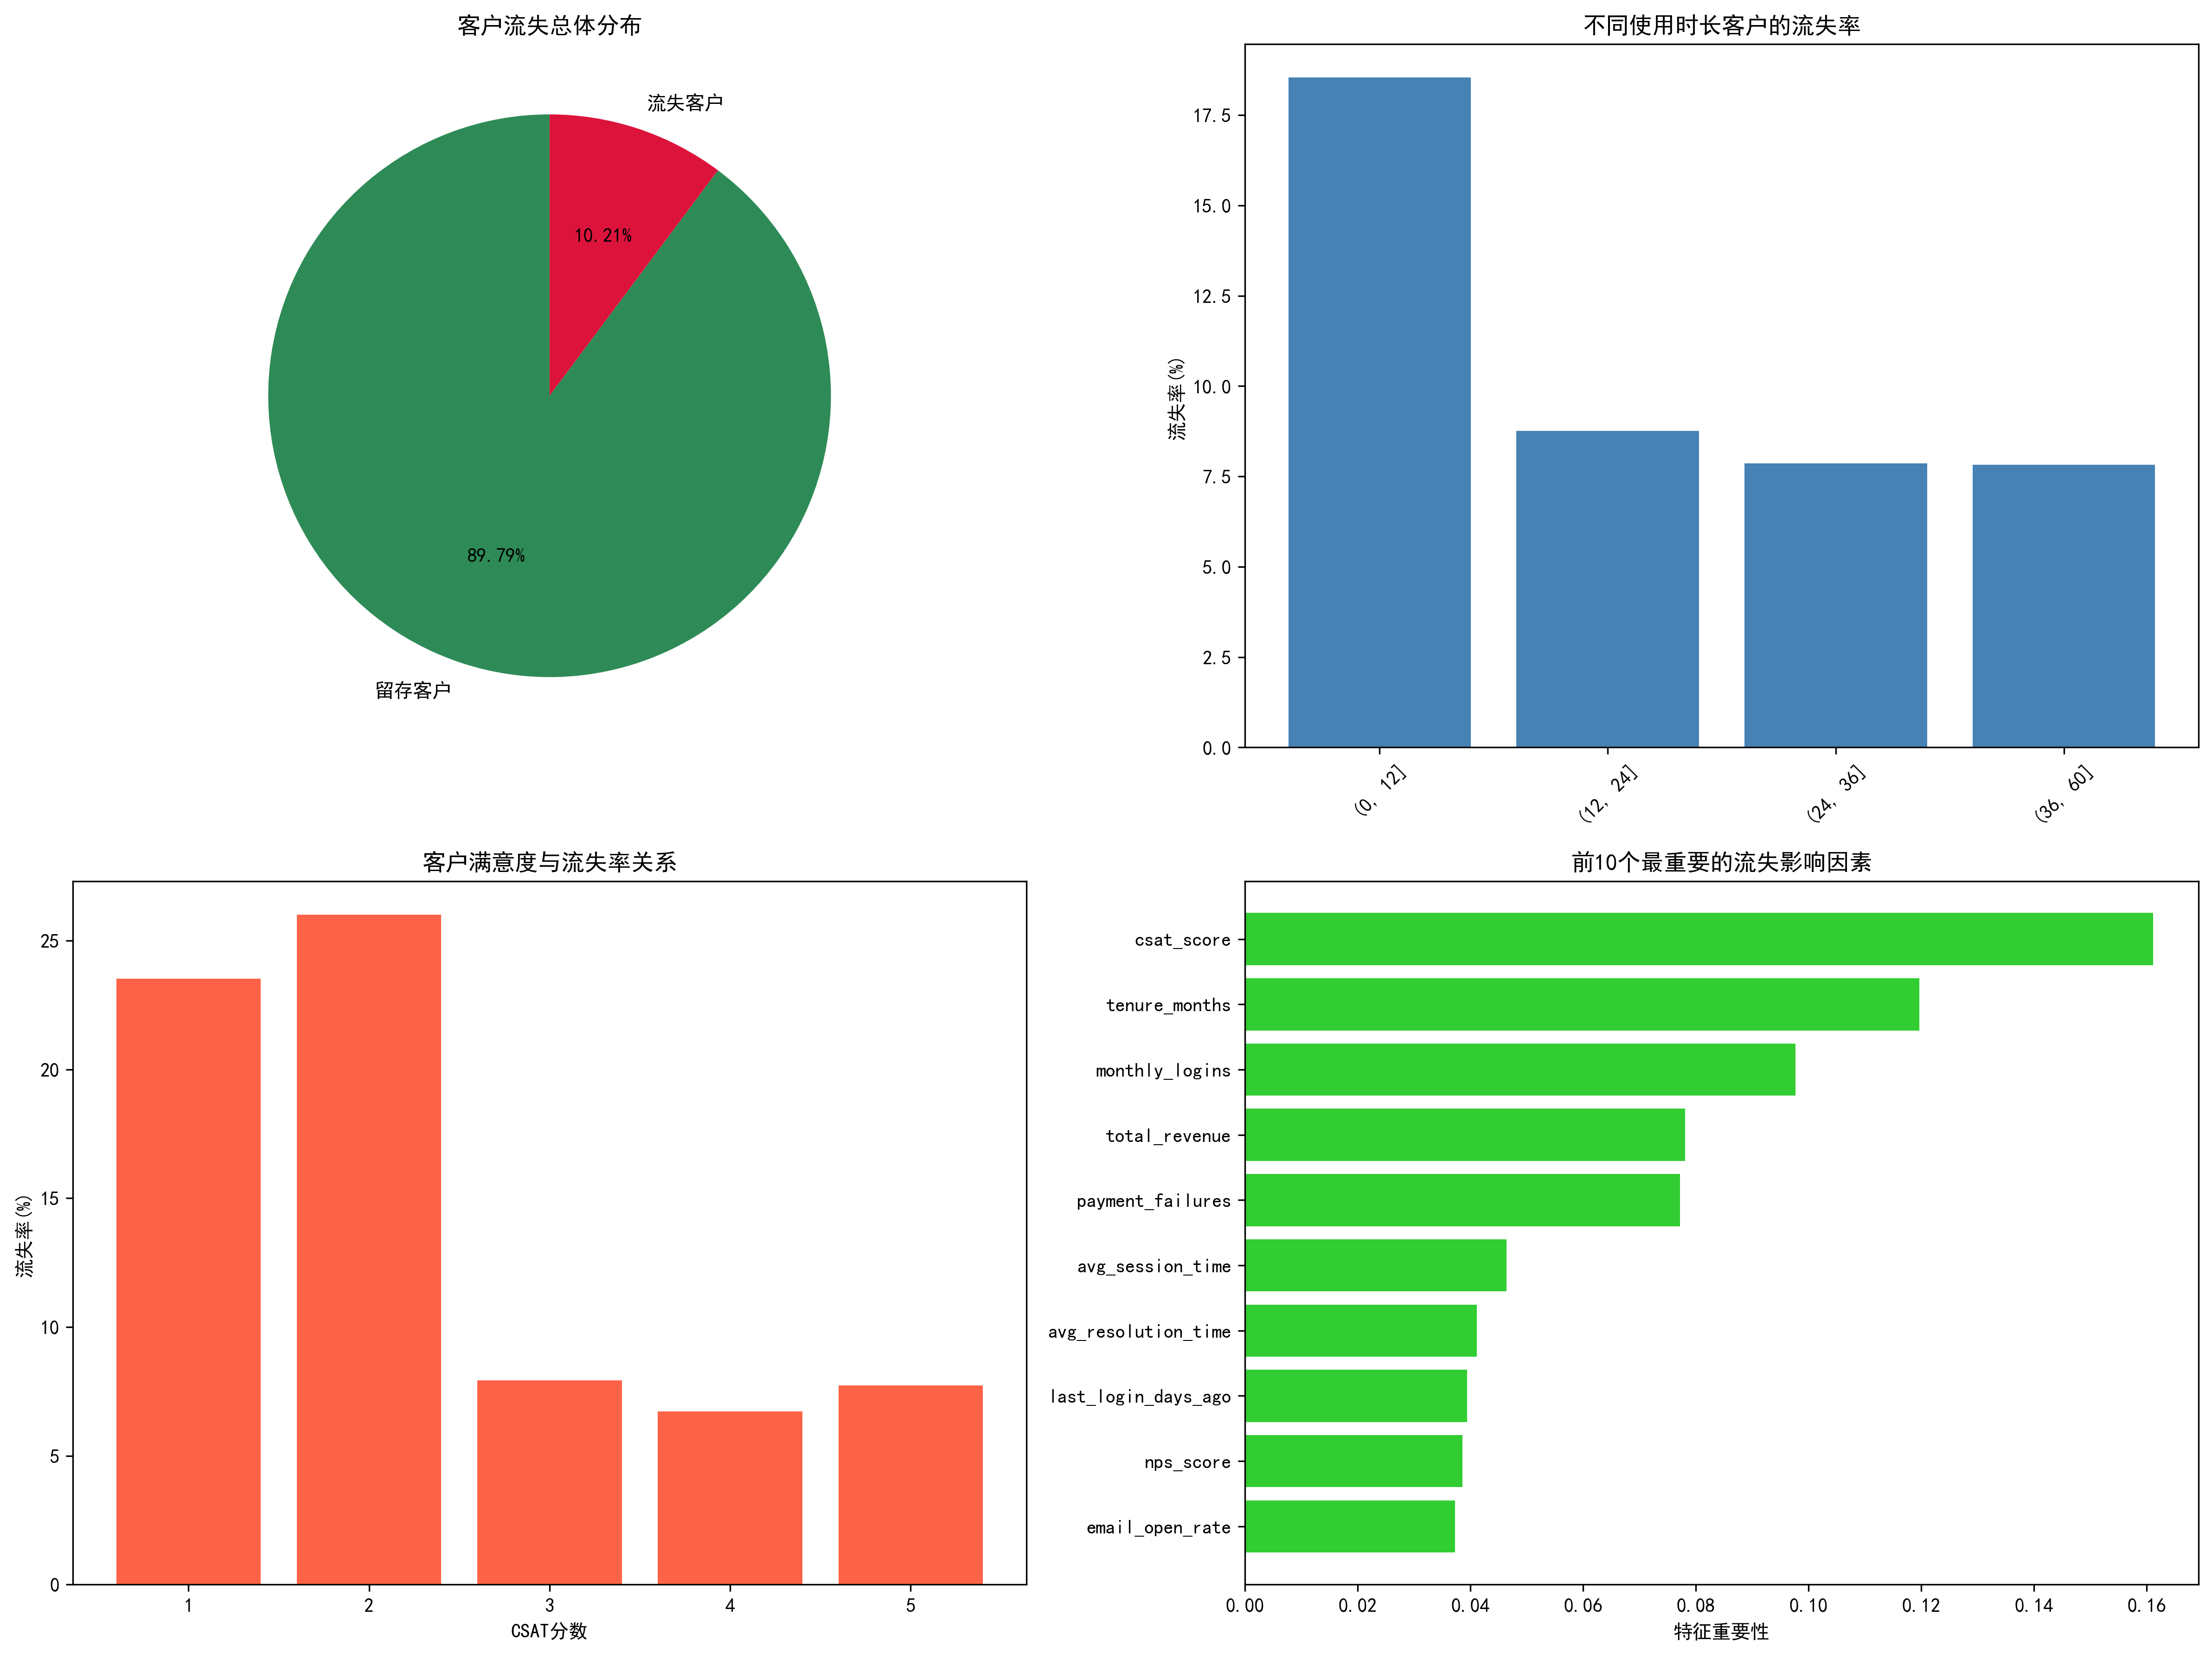
- 包含4个子图:流失分布、使用时长影响、CSAT影响、特征重要性
七、模型使用指南
7.1加载已训练模型
import joblib
import pandas as pd

# 加载模型
model = joblib.load('churn_prediction_model.pkl')

# 加载新数据
new_data = pd.read_csv('new_customer_data.csv')  # 需与训练数据格式一致

# 预测流失风险
churn_prob = model.predict_proba(new_data)[:, 1]
new_data['churn_probability'] = churn_prob.round(4)
new_data['churn_risk'] = pd.cut(churn_prob, bins=[0, 0.3, 0.6, 1.0], labels=['低风险', '中风险', '高风险'])
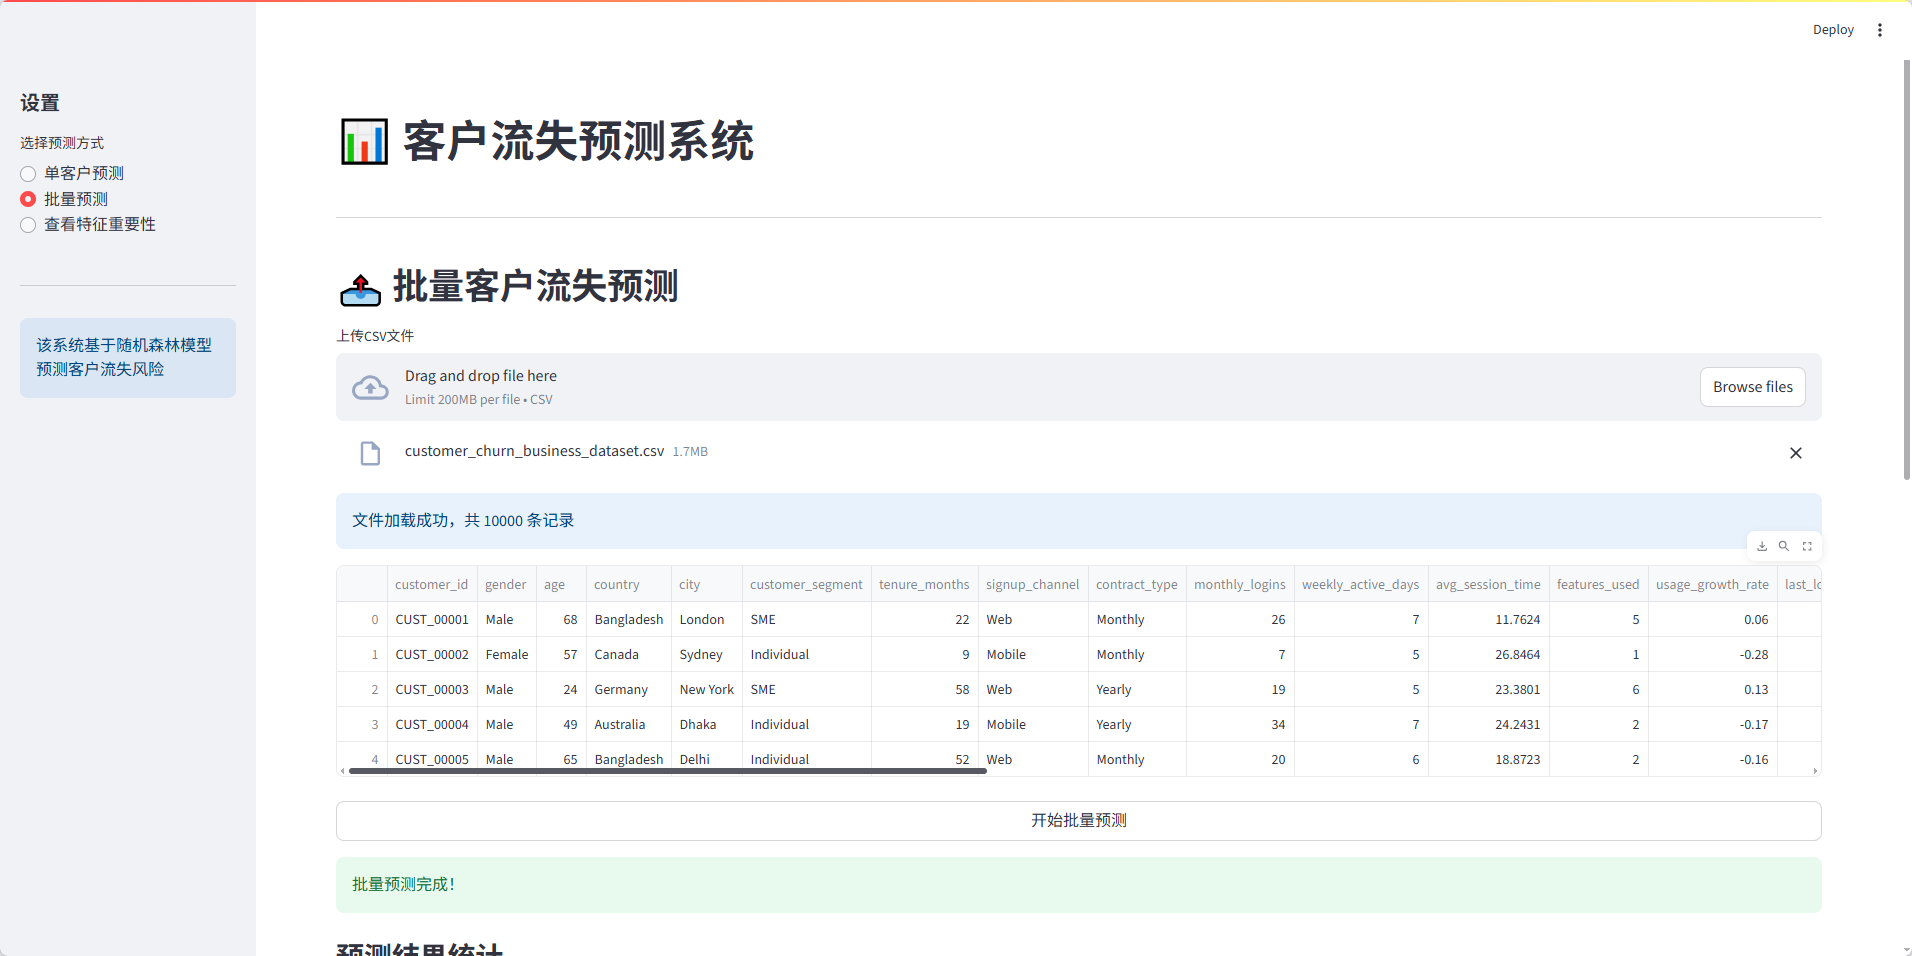
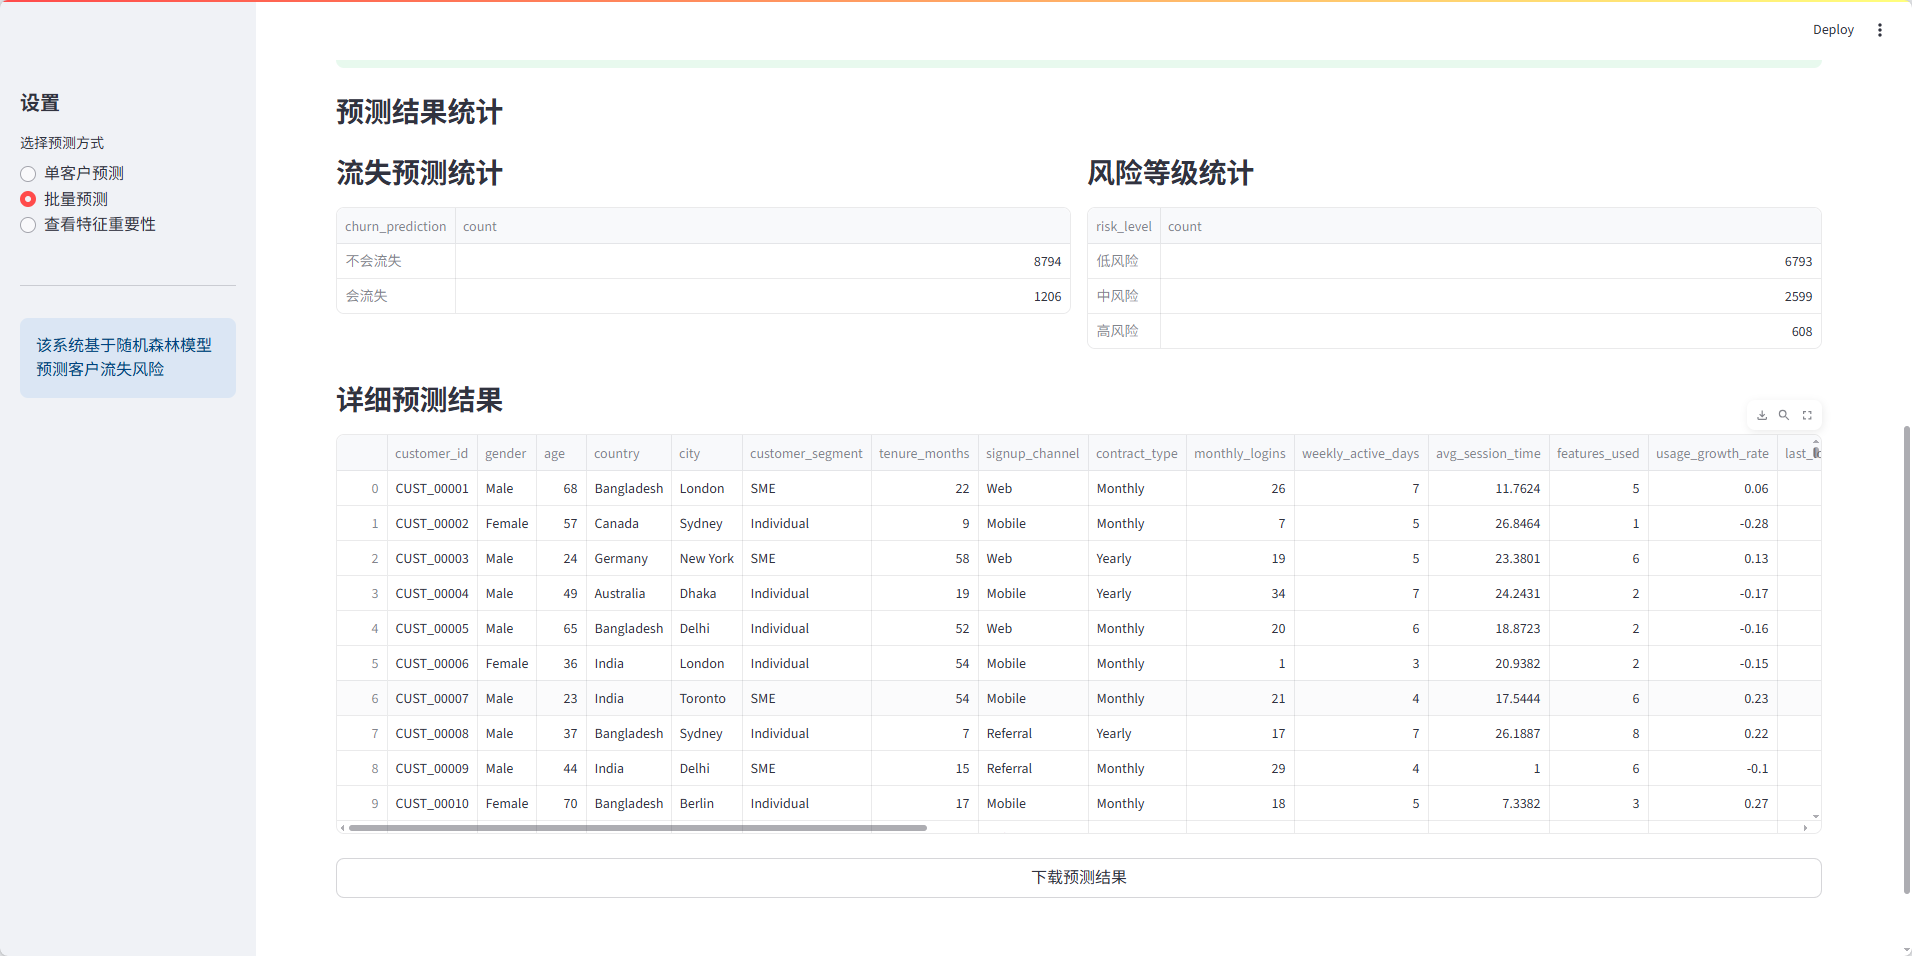
八、使用Streamlit可视化
使用以下语句运行前端:
streamlit run streamlit_churn_prediction.py
我用夸克网盘给你分享了「客户流失预测相关数据集+代码+模型」,点击链接或复制整段内容,打开「夸克APP」即可获取。
链接:https://pan.quark.cn/s/0e2fbf321c05
!数据集作者及相关信息
- 作者:ARIF MIAH
- 更新时间:数据集相关页面2025-12-14完成更新
- 版权许可:采用 Apache 2.0 许可证。
-
数据集来源:Customer Churn Prediction Business Dataset(https://www.kaggle.com/datasets/miadul/customer-churn-prediction-business-dataset)
作者:ARIF MIAH
许可证:Apache 2.0
源kaggle平台作者写的免责声明:

更多推荐

 15
15 0
0- 0


 已为社区贡献8条内容

所有评论(0)