
【刘二大人】《PyTorch深度学习实践》——梯度下降算法代码(自用)
·
梯度下降法
权重w沿着梯度下降的方向进行更新,相比枚举法效率提升不少。
代码如下:
import numpy as np
import matplotlib.pyplot as plt

x_data = [1.0,2.0,3.0]
y_data = [2.0,4.0,6.0]

#初始权重
w = 1.0
learning_rate = 0.01 #学习率

#线性模型 y = w * x
def forward(x, w):
    return w * x

#返回所有样本的平均损失
def cost(xs, ys, w):
    cost = 0
    for x,y in zip(xs, ys):
        y_pred = forward(x, w)
        cost += (y_pred - y) ** 2  #所有样本损失平方之和
    return cost / len(xs)  # 所有样本的平均损失

#梯度值
def gradient(xs, ys, w):
    grad = 0
    for x,y in zip(xs, ys):
        grad += 2 * x * (x * w - y)
    return grad / len(xs)

print('predict (before training)', 4, forward(4, w))

epoch_list = []
cost_val_list = []

for epoch in range(100):
    cost_val = cost(x_data, y_data, w)
    grad_val = gradient(x_data, y_data, w)
    w -= learning_rate * grad_val
    print('Epoch: ', epoch, 'w=', w, 'loss=', cost_val)
    epoch_list.append(epoch)
    cost_val_list.append(cost_val)
print('predict (after training)', 4, forward(4, w))

plt.plot(epoch_list, cost_val_list)
plt.xlabel('epoch')
plt.ylabel('cost val')
plt.show()
运行结果:
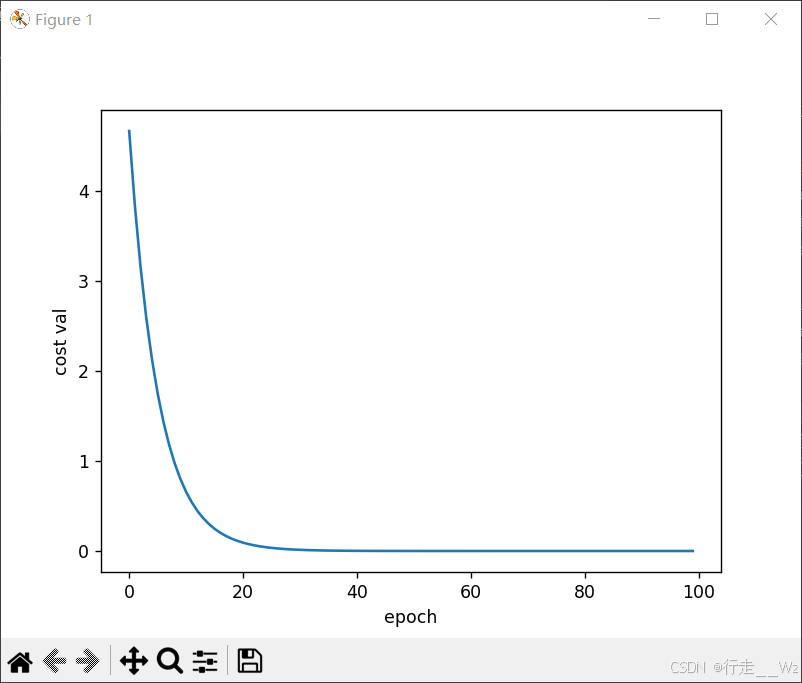
但梯度下降法也存在问题,虽然一般深度学习问题中,很少有局部最优点,但解决问题过程中常常会遇到“鞍点”,此时,算法就会被困在那里,无法进一步求解全局最优解。
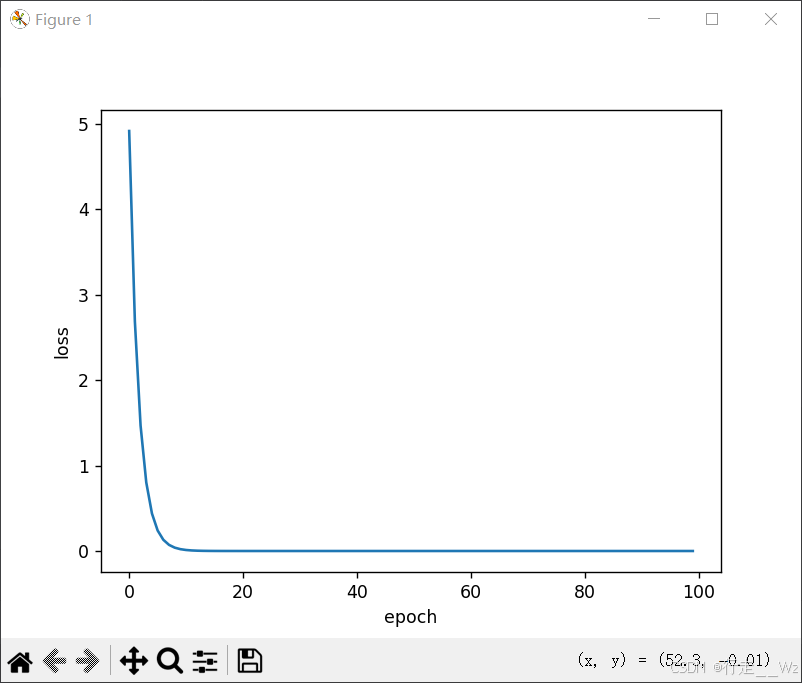
所以,可以利用随机梯度法,可能可以跳出鞍点。它的做法是,采用随机的一个样本,而不是所有样本的平均值。对于每个样本,随机梯度方法都进行了权重的更新;而一般梯度方法是针对所有样本的平均损失来进行更新权重。
随机梯度法
代码:
import matplotlib.pyplot as plt

x_data = [1.0, 2.0, 3.0]
y_data = [2.0, 4.0, 6.0]

w = 1.0
learning_rate = 0.01

def forward(x, w):
    return x * w

#一个样本的损失
def loss(x, y, w):
    y_pred = forward(x, w)
    loss = (y - y_pred) ** 2
    return loss

#随机梯度
def gradient(x, y, w):
    return 2 * x * (x * w - y)

print('predict (before training)', 4, forward(4, w))

epoch_list = []
loss_list = []

for epoch in range(100):
    for x, y in zip(x_data, y_data):

        grad = gradient(x, y, w) #一个样本的梯度
        w -= learning_rate * grad
        print('\tgrad: ', x, y, grad)
        l = loss(x, y, w)
    print('process: ', epoch, "w=", w, 'loss=', l)
    epoch_list.append(epoch)
    loss_list.append(l)
print('predict (after training)', 4, forward(4, w))

plt.plot(epoch_list, loss_list)
plt.xlabel('epoch')
plt.ylabel('loss')
plt.show()
运行结果:
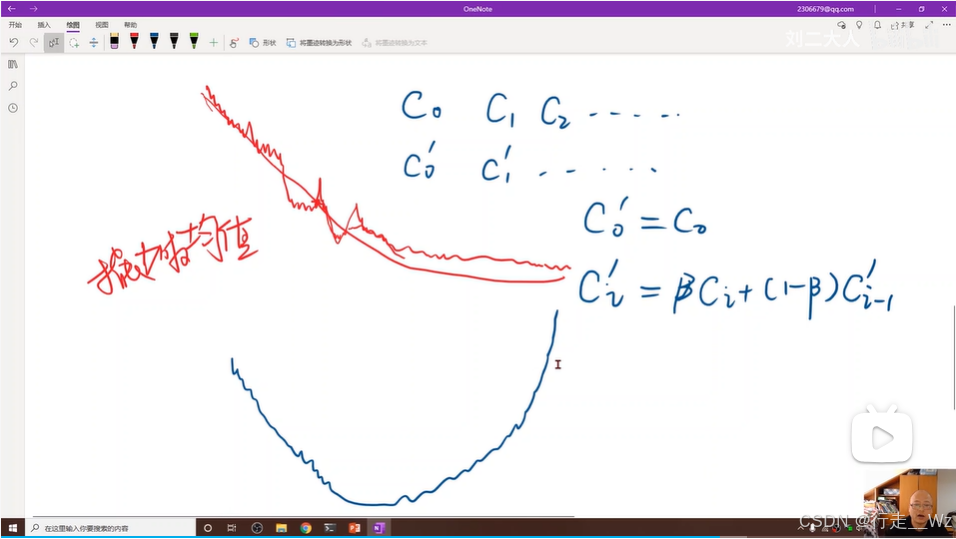
此外,更多时候下降不平滑,可以采用指数加权均值方法,使得损失图像更加的平滑。
更多推荐
 1
1 0
0- 0


 已为社区贡献10条内容

所有评论(0)