
气象监测专用折线图:可横向滚动 + 风力分级背景带完整实现
·
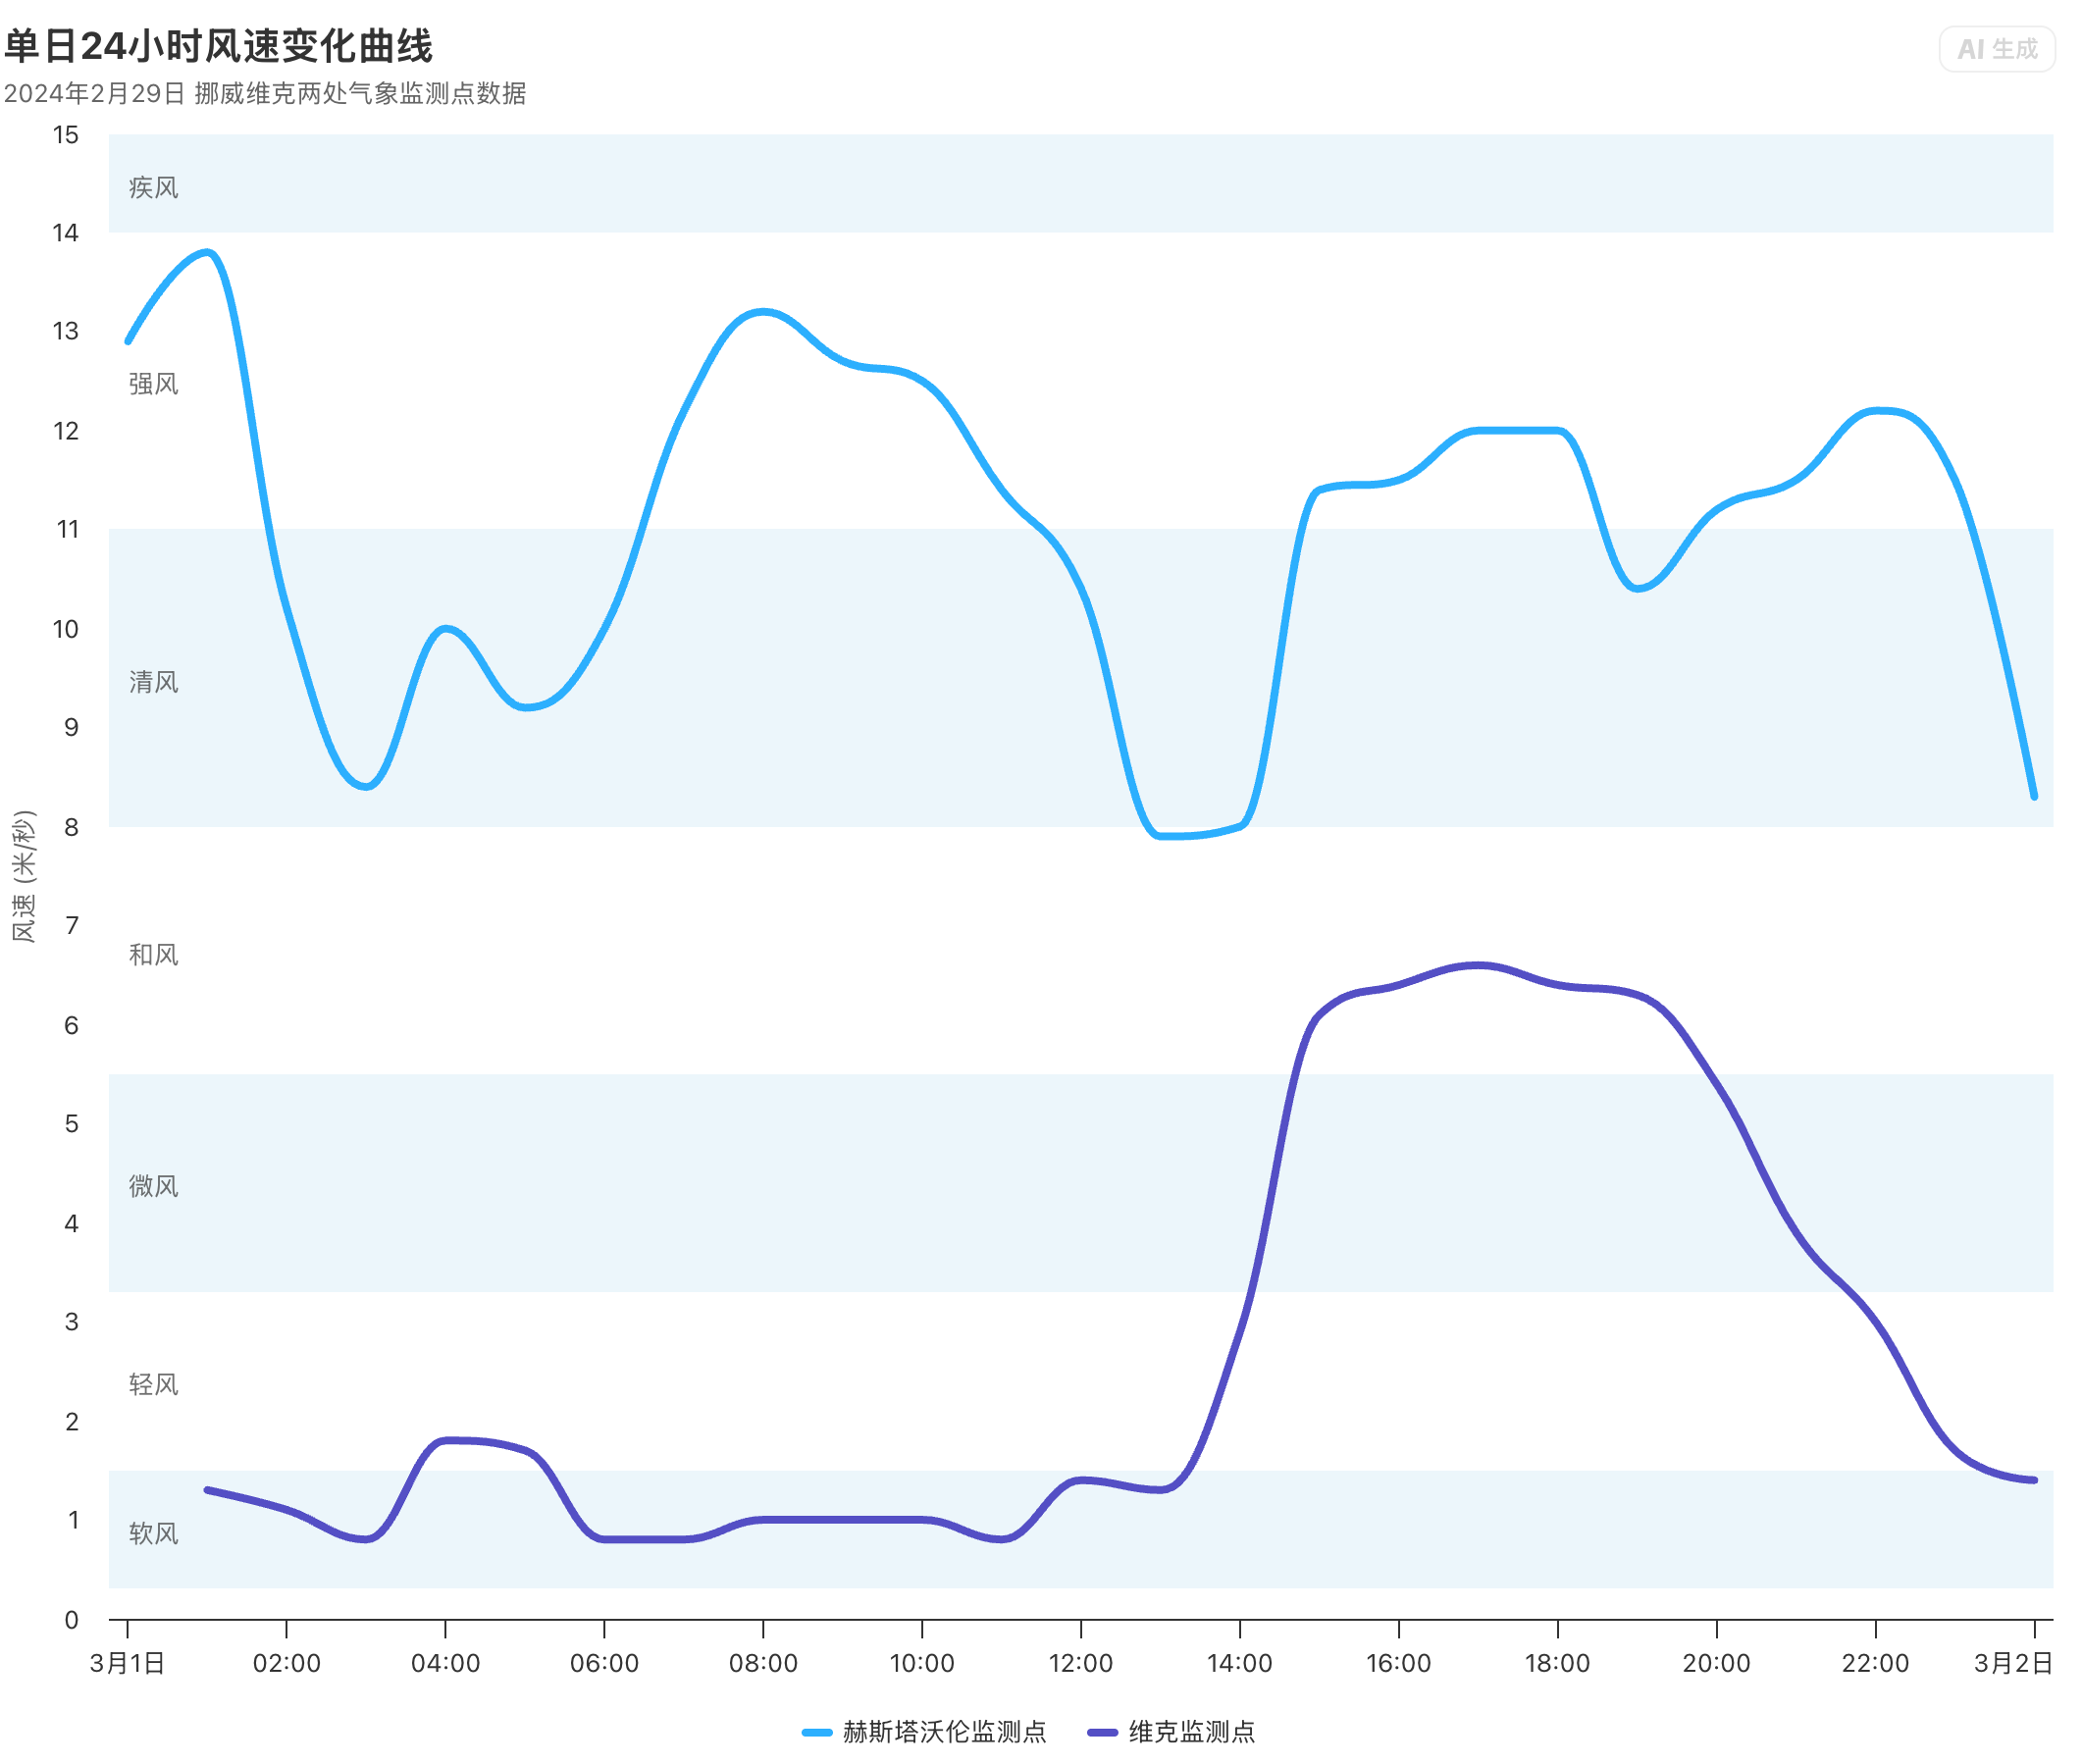
本气象风速时序图充分体现 Highcharts 面向长时序监测场景的完整可视化能力,解决长时间序列展示拥挤、分级标准不直观、时间轴构造繁琐等痛点。
HTML 代码
<!DOCTYPE html>
<html lang="zh-CN">
<head>
    <meta charset="UTF-8">
    <meta name="viewport" content="width=device-width, initial-scale=1.0">
    <title>单日风速时序监测折线图</title>
    <script src="https://code.highcharts.com/highcharts.js"></script>
    <style>
        #container {
            width: 100%;
            height: 80vh;
        }
    </style>
</head>
<body>
<div id="container"></div>
<script>
// 数据来源:挪威气象监测站点
Highcharts.chart('container', {
    chart: {
        type: 'spline',
        // 横向滚动画布,最小宽度600,默认靠右显示
        scrollablePlotArea: {
            minWidth: 600,
            scrollPositionX: 1
        }
    },
    title: {
        text: '单日24小时风速变化曲线',
        align: 'left'
    },
    subtitle: {
        text: '2024年2月29日 挪威维克两处气象监测点数据',
        align: 'left'
    },
    xAxis: {
        type: 'datetime',
        labels: {
            overflow: 'justify'
        }
    },
    yAxis: {
        title: {
            text: '风速 (米/秒)'
        },
        minorGridLineWidth: 0,
        gridLineWidth: 0,
        alternateGridColor: null,
        // 风力等级分层背景色带
        plotBands: [{
            // 软风
            from: 0.3,
            to: 1.5,
            color: 'rgba(68, 170, 213, 0.1)',
            label: {
                text: '软风',
                style: { opacity: 0.7 }
            }
        }, {
            // 轻风
            from: 1.5,
            to: 3.3,
            color: 'rgba(0, 0, 0, 0)',
            label: {
                text: '轻风',
                style: { opacity: 0.7 }
            }
        }, {
            // 微风
            from: 3.3,
            to: 5.5,
            color: 'rgba(68, 170, 213, 0.1)',
            label: {
                text: '微风',
                style: { opacity: 0.7 }
            }
        }, {
            // 和风
            from: 5.5,
            to: 8,
            color: 'rgba(0, 0, 0, 0)',
            label: {
                text: '和风',
                style: { opacity: 0.7 }
            }
        }, {
            // 清风
            from: 8,
            to: 11,
            color: 'rgba(68, 170, 213, 0.1)',
            label: {
                text: '清风',
                style: { opacity: 0.7 }
            }
        }, {
            // 强风
            from: 11,
            to: 14,
            color: 'rgba(0, 0, 0, 0)',
            label: {
                text: '强风',
                style: { opacity: 0.7 }
            }
        }, {
            // 疾风
            from: 14,
            to: 17,
            color: 'rgba(68, 170, 213, 0.1)',
            label: {
                text: '疾风',
                style: { opacity: 0.7 }
            }
        }, {
            // 大风
            from: 17,
            to: 20.5,
            color: 'rgba(0, 0, 0, 0)',
            label: {
                text: '大风',
                style: { opacity: 0.7 }
            }
        }, {
            // 烈风
            from: 20.5,
            to: 24,
            color: 'rgba(68, 170, 213, 0.1)',
            label: {
                text: '烈风',
                style: { opacity: 0.7 }
            }
        }]
    },
    tooltip: {
        valueSuffix: ' m/s'
    },
    plotOptions: {
        spline: {
            lineWidth: 4,
            states: {
                hover: {
                    lineWidth: 5
                }
            },
            marker: {
                enabled: false
            },
            pointInterval: 3600000, // 数据间隔1小时
            pointStart: '2014-02-29'
        }
    },
    series: [{
        name: '赫斯塔沃伦监测点',
        data: [
            12.9, 13.8, 10.2, 8.4, 10.0, 9.2, 10.0,
            12.2, 13.2, 12.7, 12.5, 11.4, 10.4,
            7.9, 8.0, 11.4, 11.5, 12.0, 12.0,
            10.4, 11.2, 11.5, 12.2, 11.5, 8.3
        ]
    }, {
        name: '维克监测点',
        data: [
            null, 1.3, 1.1, 0.8, 1.8, 1.7, 0.8,
            0.8, 1.0, 1.0, 1.0, 0.8, 1.4,
            1.3, 2.9, 6.1, 6.4, 6.6, 6.4,
            6.3, 5.4, 3.9, 3.0, 1.7, 1.4
        ]
    }],
    navigation: {
        menuItemStyle: {
            fontSize: '10px'
        }
    }
});
</script>
</body>
</html>
图表类型
可横向滚动平滑时序折线图(spline) 适配长时间跨度气象、环境监测时序数据,支持横向滚动浏览超长时间序列;Y 轴多层分段背景带标注分级标准。
核心功能拆解
- 超长时序横向滚动画布
scrollablePlotArea开启横向滚动,当窗口宽度不足容纳全部时间点时,底部自动出现横向滚动条,适合 24 小时、多日连续监测数据。 - Y 轴多级风力分级背景带 plotBands 按风速区间划分 9 档风力等级,交替淡蓝色底色区分区间,同时附带文字标注,无需记忆风力标准,直观判断当前风力等级。
- 小时粒度固定时序数据
pointInterval: 3600000固定数据间隔 1 小时,pointStart指定起始时间,无需手动填充时间轴数组,自动生成连续时间刻度。 - 双站点对比曲线 两组监测点位数据同图展示,支持空值
null自动断点,平滑曲线无突兀折线;关闭数据圆点,画面简洁干净。 - 悬浮提示带单位 鼠标悬浮显示精确风速 + 单位 m/s,hover 时线条自动加粗突出。
- 精简坐标轴网格 关闭次要网格、纵向网格线,仅保留分级底色,视觉清爽适合气象大屏。
适用业务场景
- 气象站风速、温度、降雨量时序监测
- 环境传感器长时间连续采集数据展示
- 水文、风力发电场全天工况监控
- 物联网设备 24 小时运行指标趋势
- 超长时序历史数据报表(支持横向滚动)
Highcharts原生支持横向滚动时序画布,通过 plotBands 实现多层分级底色标注,内置 datetime 时间轴自动生成小时刻度,固定时间间隔快速批量录入监测数据;双系列曲线对比、空值自动兼容,轻量化适配气象、物联网长时间监测大屏。
更多推荐

 4
4 0
0- 0



 已为社区贡献12条内容

所有评论(0)