
【爬虫】 Python爬取Steam热门游戏数据与30日热度排行分析
概述
Steam Charts(steamcharts.com)是一个追踪 Steam 平台游戏在线玩家数据的第三方网站,提供当前在线人数、峰值并发、游玩小时数等关键指标,以及最近 30 日的每日 Hours Played 趋势图。
本文介绍如何用 Python 爬取 Steam Charts Top 500 游戏数据,重点解决以下问题:
- 页面结构分析 — 表格数据与 JavaScript 内嵌时序数据的提取
- 原始 HTML 缓存 — 避免重复请求,便于后续二次分析
- 30 日热度排行 — 从 sparkline 图表数据中提取每日 Hours Played,汇总生成热度排行
页面结构分析
表格结构
Steam Charts 的 Top Games 页面采用分页展示,每页 25 款游戏,URL 格式为:
https://steamcharts.com/top/p.1
https://steamcharts.com/top/p.2
...
https://steamcharts.com/top/p.20
页面中的表格 #top-games table 有 6 列:
| 列索引 | 表头 | class | 说明 |
|---|---|---|---|
| td[0] | (空) | — | 排名序号 |
| td[1] | Name | game-name left | 游戏名,包含 /app/{id} 链接 |
| td[2] | Current Players | num | 当前在线玩家数 |
| td[3] | Last 30 Days | chart period-col | sparkline 图表占位(无文本) |
| td[4] | Peak Players | num period-col peak-concurrent | 峰值并发玩家数 |
| td[5] | Hours Played | num period-col player-hours | 总游玩小时数 |
关键点:td[3] 是一个空的图表占位单元格,不包含数值文本。实际的 30 日趋势数据隐藏在页面底部的 JavaScript 代码中。
JavaScript 中的 sparkline 时序数据
每个游戏的 30 日每日 Hours Played 数据以 JavaScript 数组形式嵌入在 HTML 中:
elem = app.e('spark_730');
elem.datax = ["2026-03-28T00:00:00Z","2026-03-29T00:00:00Z",...];
elem.datay = [27173351,26517172,22976092,...];
svg = d3.select(elem).append('svg');
app.sparkbars(elem, svg, 150, 40, thirtyDays, now, 0, 27173351,
    elem.datax, elem.datay, mouseoverFn);
其中:
spark_730中的730对应 Steam App ID(如 Counter-Strike 2)datax是日期数组(31 天,含当天不完整数据)datay是对应每日的 Hours Played
这些数据用于 D3.js 渲染 sparkline 条形图,但我们可以直接用正则提取。
爬虫实现
核心架构
项目采用爬取-缓存-分析三阶段分离设计:
spider-steamcharts/
├── scraper.py              # 爬虫:爬取 + 缓存原始 HTML
├── analyzer.py             # 分析:读取 JSON 生成排行数据
├── data/                   # 原始 HTML 缓存(按日期+页码)
│   ├── 2026-04-27_p01.html
│   ├── 2026-04-27_p02.html
│   └── ...
├── steam_top_games.csv     # 汇总 CSV
├── steam_top_games.json    # 完整 JSON(含时序数据)
└── race_data.py            # 条形图赛跑动画数据
原始 HTML 缓存策略
缓存的是原始请求响应而非解析后的数据,这样后续可以用不同的解析逻辑重新提取:
DATA_DIR = os.path.join(OUTPUT_DIR, "data")

def cache_path(today: str, page: int) -> str:
    """生成缓存文件路径: data/2026-04-27_p01.html"""
    return os.path.join(DATA_DIR, f"{today}_p{page:02d}.html")

def fetch_page(page: int, today: str) -> list[dict]:
    html_path = cache_path(today, page)

    # 优先读本地缓存
    if os.path.exists(html_path):
        with open(html_path, "r", encoding="utf-8") as f:
            html = f.read()
        games = parse_page(html)
        print(f"第 {page} 页: 从本地缓存读取 ({len(games)} 条)")
        return games, False

    # 无缓存则发起网络请求
    url = BASE_URL.format(page)
    resp = requests.get(url, headers=HEADERS, timeout=15)
    resp.raise_for_status()

    # 保存原始 HTML
    with open(html_path, "w", encoding="utf-8") as f:
        f.write(resp.text)

    games = parse_page(resp.text)
    return games, True
缓存文件名包含日期,第二天运行时自动重新爬取。同一天内重复运行则全部从本地读取,耗时从约 40 秒降至不到 1 秒。
表格数据解析
def parse_page(html: str) -> list[dict]:
    soup = BeautifulSoup(html, "html.parser")
    table = soup.select_one("#top-games table") or soup.select_one("table")
    rows = table.select("tbody tr") or table.select("tr")[1:]

    games = []
    for tr in rows:
        cols = tr.select("td")
        if len(cols) < 5:
            continue
        rank_text = cols[0].get_text(strip=True)

        name_tag = cols[1].select_one("a")
        name = name_tag.get_text(strip=True) if name_tag else cols[1].get_text(strip=True)
        href = name_tag["href"] if name_tag and name_tag.has_attr("href") else ""
        app_id = href.split("/app/")[-1].split("/")[0] if "/app/" in href else ""

        # td[2]=当前玩家, td[3]=sparkline图表(空), td[4]=峰值并发, td[5]=游玩小时
        current_players = cols[2].get_text(strip=True).replace(",", "")
        peak_players = cols[4].get_text(strip=True).replace(",", "")
        hours_played = cols[5].get_text(strip=True).replace(",", "")

        games.append({
            "rank": rank_text,
            "name": name,
            "app_id": app_id,
            "current_players": current_players,
            "peak_players": peak_players,
            "hours_played": hours_played,
        })
    return games
提取 30 日时序数据
通过正则匹配 JavaScript 中的 datax 和 datay 数组:
import re

def parse_sparkline_data(html: str) -> dict[str, dict]:
    """从 JavaScript 中提取每个 app 的 30 日 Hours Played 时序数据"""
    spark_data = {}
    pattern = re.compile(
        r"app\.e\('spark_(\d+)'\).*?"
        r"elem\.datax\s*=\s*\[([^\]]+)\].*?"
        r"elem\.datay\s*=\s*\[([^\]]+)\]",
        re.DOTALL
    )
    for m in pattern.finditer(html):
        app_id = m.group(1)
        dates = [d.strip().strip('"') for d in m.group(2).split(",")]
        hours = [int(h.strip()) for h in m.group(3).split(",")]
        spark_data[app_id] = {"dates": dates, "hours": hours}
    return spark_data
正则模式说明:
app\.e\('spark_(\d+)'\)— 匹配app.e('spark_730'),捕获 App IDelem\.datax\s*=\s*\[([^\]]+)\]— 捕获日期数组elem\.datay\s*=\s*\[([^\]]+)\]— 捕获小时数组re.DOTALL— 让.匹配换行符,因为三段代码跨越多行
30 日热度排行分析
分析脚本
analyzer.py 从 steam_top_games.json 读取数据,生成适合条形图赛跑动画的格式:
import json
import os

SCRIPT_DIR = os.path.dirname(os.path.abspath(__file__))
JSON_PATH = os.path.join(SCRIPT_DIR, "steam_top_games.json")
OUTPUT_PATH = os.path.join(SCRIPT_DIR, "race_data.py")
TOP_N = 20

def main():
    with open(JSON_PATH, "r", encoding="utf-8") as f:
        all_games = json.load(f)

    games_with_daily = [g for g in all_games if "daily_hours" in g]

    # 排除最后一天(当天数据不完整)
    for g in games_with_daily:
        dates = g["daily_hours"]["dates"]
        hours = g["daily_hours"]["hours"]
        g["_dates"] = [d[:10] for d in dates[:-1]]
        g["_hours"] = hours[:-1]
        g["_total"] = sum(g["_hours"])

    # 按 30 日总 Hours 降序,取 Top N
    games_with_daily.sort(key=lambda g: g["_total"], reverse=True)
    top_games = games_with_daily[:TOP_N]

    all_dates = sorted(set(d for g in top_games for d in g["_dates"]))

    # 构建查找表
    lookup = {}
    for g in top_games:
        lookup[g["name"]] = dict(zip(g["_dates"], g["_hours"]))

    # 生成 [日期, 游戏名, 当日Hours]
    data = []
    for date in all_dates:
        for g in top_games:
            hours = lookup[g["name"]].get(date, 0)
            data.append([date, g["name"], hours])

    # 保存为可 import 的 Python 文件
    with open(OUTPUT_PATH, "w", encoding="utf-8") as f:
        f.write("data = [\n")
        for row in data:
            f.write(f'    ["{row[0]}", "{row[1]}", {row[2]}],\n')
        f.write("]\n")
关键设计决策:
- 排除当天数据:最后一天的数据尚未完整,直接参与排名会导致偏差
- Top 20 过滤:500 款游戏全部展示过于拥挤,取头部即可
- 输出为
.py文件:可直接from race_data import data,方便下游可视化脚本使用
输出数据格式
data = [
    ["2026-03-28", "Counter-Strike 2", 27173351],
    ["2026-03-28", "Dota 2", 11449360],
    ["2026-03-28", "PUBG: BATTLEGROUNDS", 9241530],
    ...
]
每条记录为 [日期, 游戏名, 当日 Hours Played],共 600 条(20 款游戏 x 30 天),按日期升序排列。
热度排行结果
最近 30 日(2026-03-28 ~ 2026-04-26)Steam 游戏 Hours Played 排行 Top 20:
| 排名 | 游戏 | 30日总Hours | 日均Hours |
|---|---|---|---|
| 1 | Counter-Strike 2 | 710,520,281 | 23,263,416 |
| 2 | Dota 2 | 309,967,154 | 10,158,530 |
| 3 | PUBG: BATTLEGROUNDS | 255,764,893 | 8,396,363 |
| 4 | Slay the Spire 2 | 134,294,035 | 4,391,013 |
| 5 | FiveM | 94,915,611 | 3,104,866 |
| 6 | Apex Legends | 92,090,932 | 3,016,708 |
| 7 | Crimson Desert | 89,023,188 | 2,899,951 |
| 8 | Bongo Cat | 87,582,290 | 2,890,208 |
| 9 | Rust | 76,544,433 | 2,499,480 |
| 10 | ARC Raiders | 56,746,543 | 1,851,528 |
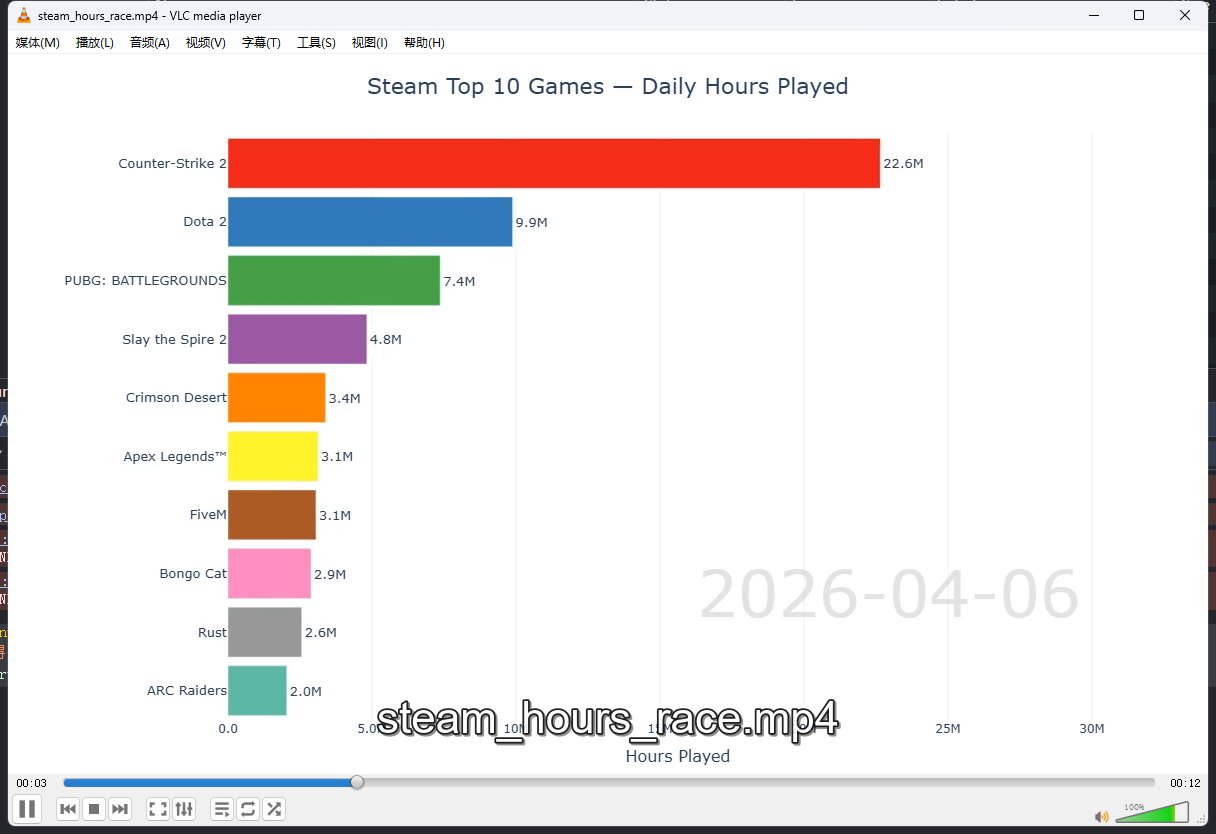
Counter-Strike 2 以日均 2300 万小时的绝对优势稳居榜首,是第二名 Dota 2 的两倍多。
踩坑记录
列偏移陷阱
页面表头显示 6 列:(空)、Name、Current Players、Last 30 Days、Peak Players、Hours Played,容易误以为 td[3] 是"Last 30 Days"的数值。实际上 td[3] 是一个带 class="chart" 的空单元格,用于渲染 sparkline 图表。真正的数值从 td[4] 开始。
验证方法:
tr = table.select("tbody tr")[0]
tds = tr.select("td")
for i, td in enumerate(tds):
    print(f"td[{i}]: [{td.get_text(strip=True)[:30]}] class={td.get('class')}")
Windows 终端编码
游戏名中包含 ™、® 等特殊字符(如 Apex Legends™),在 Windows GBK 终端中 print() 会抛出 UnicodeEncodeError。解决方案:
name = g['name'].encode('gbk', errors='replace').decode('gbk')
print(name)
注意这只影响终端输出,写入 UTF-8 编码的文件不受影响。
总结
本文实现了一个完整的 Steam 游戏数据采集与分析流程:
- 爬虫层:20 页分页爬取,原始 HTML 按日期缓存,支持断点续爬
- 解析层:表格数据 + JavaScript sparkline 时序数据双重提取
- 分析层:独立脚本读取 JSON,输出标准化的排行数据格式
缓存原始 HTML 而非解析结果是关键设计——当发现页面中还隐藏了 sparkline 时序数据时,无需重新爬取即可重新解析,这在迭代式的数据探索过程中节省了大量时间。
ps: 数据用于大数据可视化,效果图如下:
参考资料
- Steam Charts: https://steamcharts.com/top
- 【Plotly】数据可视化利器推荐 https://blog.csdn.net/ShyanZh/article/details/160509805
- 【Plotly】Plotly动态条形图赛跑动画优化及视频mp4导出 https://blog.csdn.net/ShyanZh/article/details/160565638

小龙虾开发者社区是 CSDN 旗下专注 OpenClaw 生态的官方阵地,聚焦技能开发、插件实践与部署教程,为开发者提供可直接落地的方案、工具与交流平台,助力高效构建与落地 AI 应用
更多推荐


 18
18 0
0- 0


 已为社区贡献7条内容

所有评论(0)