
基于Python+Vue的天气数据分析与可视化系统
·
一、项目概述
随着气候变化日益受到关注,对历史天气数据的分析和可视化展示变得尤为重要。本项目是一个基于Python + Vue3的前后端分离架构的天气数据分析与可视化系统,实现了从数据采集、清洗、存储、分析到可视化展示和预测的全流程功能。
1.1 主要功能
-
✅ 多城市历史天气数据自动爬取
-
✅ 用户注册/登录与权限管理
-
✅ 温度、天气类型、风向风力、空气质量等多维度数据可视化
-
✅ 天气词云展示
-
✅ 基于机器学习的天气趋势预测
-
✅ 支持MySQL数据库,支持增量更新
1.2 技术架构
项目采用前后端分离架构:
[用户浏览器]
     ↓ HTTP/REST API
[Vue3前端] → Element Plus + ECharts
     ↓
[Flask后端] → SQLAlchemy ORM
     ↓
[MySQL数据库] → 星型模式数据仓库
     ↑
[Python爬虫] → Selenium + BeautifulSoup
     ↓
[Pandas] → 数据清洗
     ↓
[Scikit-learn] → 预测模型
架构特点:
-
前后端完全解耦,便于独立开发和部署
-
数据仓库采用星型模式,支持OLAP多维分析
-
模块化设计,爬虫、清洗、入库、API服务可独立运行
-
支持大数据量性能优化
二、技术栈详解
| 类别 | 技术 |
|---|---|
| 后端 | Python 3.11+, Flask 3.0.0, Flask-SQLAlchemy 3.1.1, MySQL 8.0+ |
| 前端 | Vue3 3.4.15, Element Plus 2.5.1, ECharts 5.4.3, Vite 5.0.11 |
| 爬虫 | Selenium, BeautifulSoup4 |
| 数据处理 | Pandas 2.1.4, NumPy 1.26.2 |
| 机器学习 | Scikit-learn 1.3.2(线性回归、随机森林) |
三、项目目录结构
weather_items/
├── backend/                    # 后端服务
│   ├── app/
│   │   ├── api/               # API接口模块
│   │   │   ├── auth.py        # 用户认证
│   │   │   ├── dashboard.py   # 数据概览
│   │   │   ├── records.py     # 数据查询
│   │   │   ├── analysis.py    # 时间分析
│   │   │   ├── weather_analysis.py  # 气象分析
│   │   │   ├── wordcloud.py   # 词云服务
│   │   │   └── prediction.py  # 预测服务
│   │   ├── models.py          # 数据模型
│   │   ├── cache.py           # 缓存配置
│   │   └── ml_prediction.py   # 机器学习模块
│   ├── uploads/avatars/       # 用户头像
│   ├── config.py              # 配置文件
│   ├── requirements.txt       # Python依赖
│   └── run.py                 # 启动脚本
│
├── frontend/                   # 前端应用
│   └── weather-frontend/
│       ├── src/
│       │   ├── api/           # API请求封装
│       │   ├── views/         # 页面组件
│       │   │   ├── Dashboard.vue      # 数据概览
│       │   │   ├── Records.vue        # 数据查询
│       │   │   ├── TimeAnalysis.vue   # 时间分析
│       │   │   ├── WeatherAnalysis.vue # 气象分析
│       │   │   ├── CityComparison.vue # 城市对比
│       │   │   ├── TemperatureMap.vue # 气温地图
│       │   │   ├── WordCloud.vue      # 词云图
│       │   │   └── Prediction.vue     # 天气预测
│       │   ├── router/        # 路由配置
│       │   ├── store/         # Pinia状态管理
│       │   └── utils/         # 工具函数
│       ├── package.json
│       └── vite.config.js
│
├── spider/                     # 数据采集
│   ├── data/                  # 数据文件
│   ├── 爬虫代码.py            # 主爬虫程序
│   ├── 清洗代码1.py           # 数据清洗(初洗)
│   ├── 清洗代码2.py           # 数据清洗(精洗)
│   ├── 数据入库.py            # 数据库导入
│   ├── 数据更新入库.py        # 增量更新工具
│   └── weather_codes_*.json   # 城市编码配置
│
└── 项目总结.md                # 项目文档
四、数据库设计
4.1 星型模式(Star Schema)
采用数据仓库的星型模式设计,便于OLAP多维分析:
                    ┌─────────────────┐
                    │   dim_date      │
                    │   (时间维度)     │
                    └────────┬────────┘
                             │
    ┌─────────────────┐      │      ┌─────────────────┐
    │  dim_province   │      │      │   dim_city      │
    │   (省份维度)     │      │      │   (城市维度)     │
    └────────┬────────┘      │      └────────┬────────┘
             │               │               │
             └───────────────┼───────────────┘
                             │
                    ┌────────▼────────┐
                    │  fact_weather   │
                    │   (事实数据表)   │
                    └─────────────────┘
                             │
                    ┌────────▼────────┐
                    │ dim_weather_type│
                    │   (天气维度)     │
                    └─────────────────┘
4.2 核心表结构
事实表 fact_weather

CREATE TABLE fact_weather (
    id BIGINT PRIMARY KEY AUTO_INCREMENT,
    date_id INT COMMENT '时间维度外键',
    city_id INT COMMENT '城市维度外键',
    weather_type_id INT COMMENT '天气维度外键',
    max_temp DECIMAL(4,1) COMMENT '最高温度',
    min_temp DECIMAL(4,1) COMMENT '最低温度',
    wind_direction VARCHAR(20) COMMENT '风向',
    wind_level VARCHAR(20) COMMENT '风力',
    aqi INT COMMENT '空气质量指数',
    created_at TIMESTAMP DEFAULT CURRENT_TIMESTAMP
);
五、核心功能实现
5.1 数据采集模块
使用 Selenium + BeautifulSoup 抓取某天气网站((如“中国天气网”、“天气网”))历史数据:
# spider/爬虫代码.py
from selenium import webdriver
from bs4 import BeautifulSoup
def crawl_weather(city_code, year, month):
"""爬取指定城市指定年月的天气数据"""
url = f"https://www.weather.com/history/{city}/{date}.htm"
driver = webdriver.Chrome(options=options)
driver.get(url)
soup = BeautifulSoup(driver.page_source, 'html.parser')
# 解析天气数据
weather_data = []
for row in soup.select('table tr'):
cells = row.find_all('td')
if len(cells) >= 6:
weather_data.append({
'date': cells[0].text.strip(),
'max_temp': cells[1].text.strip(),
'min_temp': cells[2].text.strip(),
'weather': cells[3].text.strip(),
'wind_direction': cells[4].text.strip(),
'wind_level': cells[5].text.strip()
})
driver.quit()
return weather_data
5.2 数据清洗模块
使用 Pandas 进行数据清洗和转换:
# spider/清洗代码2.py
import pandas as pd
class WeatherDataCleaner:
def clean_data(self, df):
"""清洗天气数据"""
# 处理缺失值
df = df.dropna(subset=['date', 'max_temp', 'min_temp'])
# 处理异常值
df = df[(df['max_temp'] >= -50) & (df['max_temp'] <= 50)]
df = df[(df['min_temp'] >= -50) & (df['min_temp'] <= 50)]
# 数据类型转换
df['date'] = pd.to_datetime(df['date'])
df['max_temp'] = pd.to_numeric(df['max_temp'], errors='coerce')
df['min_temp'] = pd.to_numeric(df['min_temp'], errors='coerce')
# 提取年月日
df['year'] = df['date'].dt.year
df['month'] = df['date'].dt.month
df['day'] = df['date'].dt.day
return df
5.3 后端API实现
使用 Flask + SQLAlchemy 提供RESTful API:
# backend/app/api/analysis.py
from flask import Blueprint, request, jsonify
from app.models import db, FactWeather, DimCity, DimDate
analysis_bp = Blueprint('analysis', __name__)
@analysis_bp.route('/time-trend', methods=['GET'])
def get_time_trend():
"""获取时间趋势数据"""
city_id = request.args.get('city_id', type=int)
year = request.args.get('year', type=int)
query = db.session.query(
DimDate.date,
FactWeather.max_temp,
FactWeather.min_temp,
FactWeather.aqi
).join(DimDate).join(DimCity)
if city_id:
query = query.filter(FactWeather.city_id == city_id)
if year:
query = query.filter(DimDate.year == year)
results = query.order_by(DimDate.date).all()
return jsonify([{
'date': r.date.strftime('%Y-%m-%d'),
'max_temp': r.max_temp,
'min_temp': r.min_temp,
'aqi': r.aqi
} for r in results])
5.4 前端可视化实现
使用 Vue3 + ECharts 实现数据可视化:
<!-- frontend/weather-frontend/src/views/TimeAnalysis.vue -->
<template>
<div ref="trendChartDom" class="chart-container"></div>
</template>
<script setup>
import { ref, onMounted } from 'vue'
import * as echarts from 'echarts'
import { getTimeTrend } from '../api/analysis'
const trendChartDom = ref(null)
const trendData = ref([])
const initTrendChart = () => {
const chart = echarts.init(trendChartDom.value)
const option = {
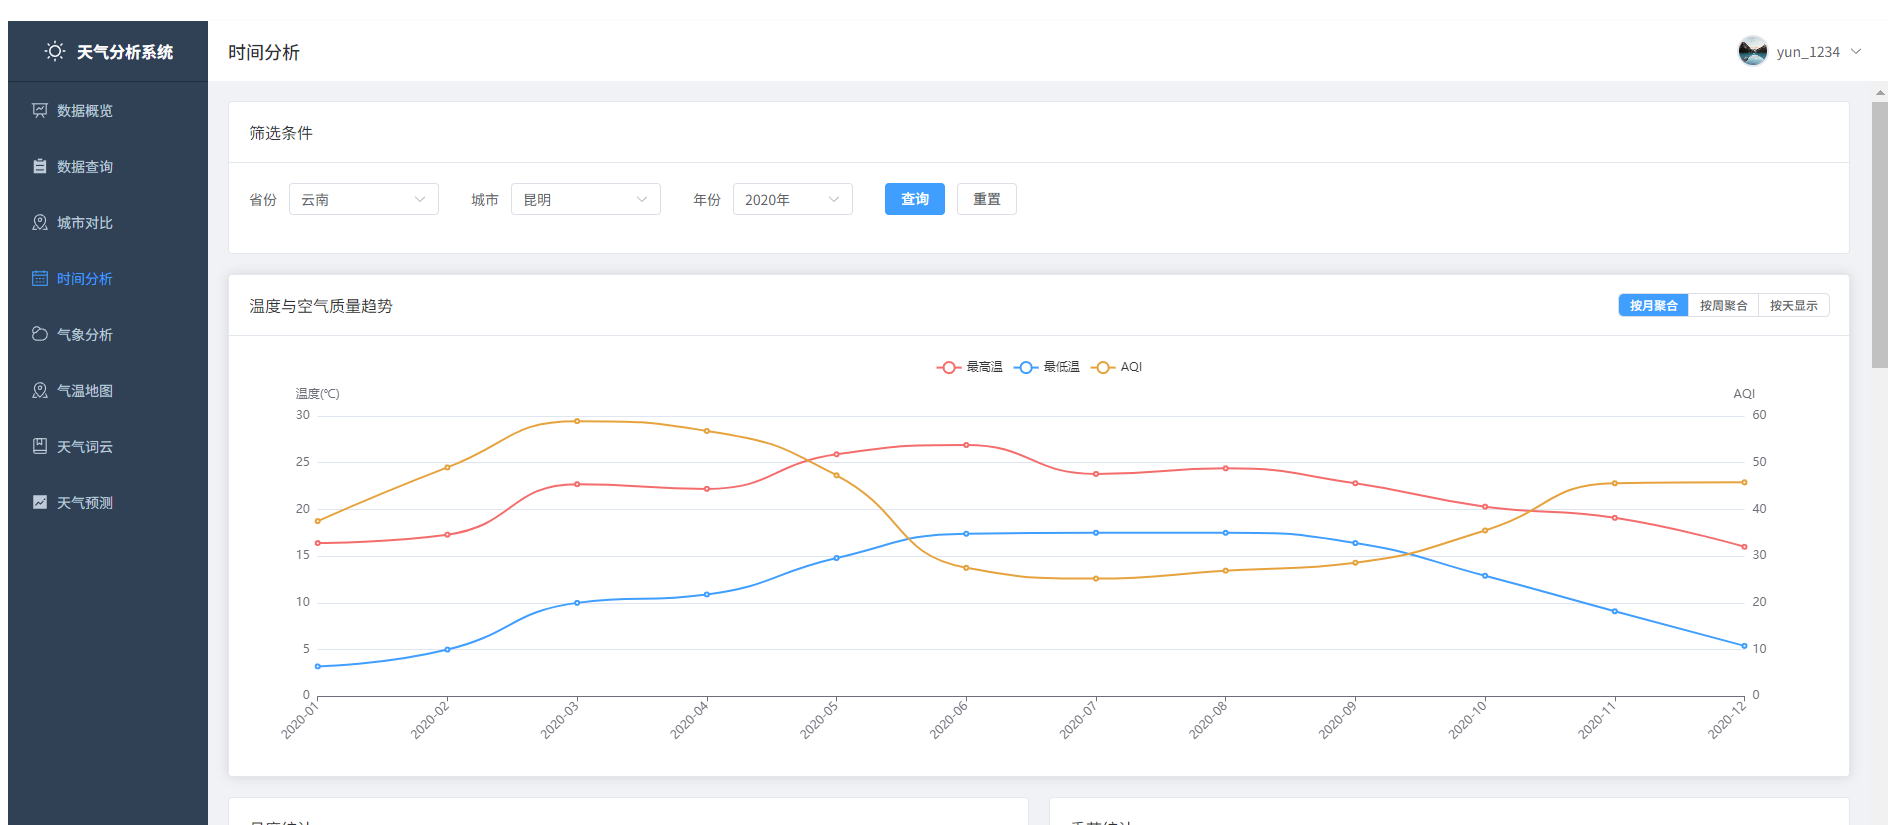
title: { text: '温度与空气质量趋势' },
tooltip: { trigger: 'axis' },
legend: { data: ['最高温', '最低温', 'AQI'] },
xAxis: {
type: 'category',
data: trendData.value.map(d => d.date)
},
yAxis: [
{ type: 'value', name: '温度(℃)' },
{ type: 'value', name: 'AQI' }
],
series: [
{
name: '最高温',
type: 'line',
data: trendData.value.map(d => d.max_temp),
smooth: true
},
{
name: '最低温',
type: 'line',
data: trendData.value.map(d => d.min_temp),
smooth: true
},
{
name: 'AQI',
type: 'line',
yAxisIndex: 1,
data: trendData.value.map(d => d.aqi),
smooth: true
}
]
}
chart.setOption(option)
}
onMounted(async () => {
trendData.value = await getTimeTrend()
initTrendChart()
})
</script>
六、系统截图(部分)
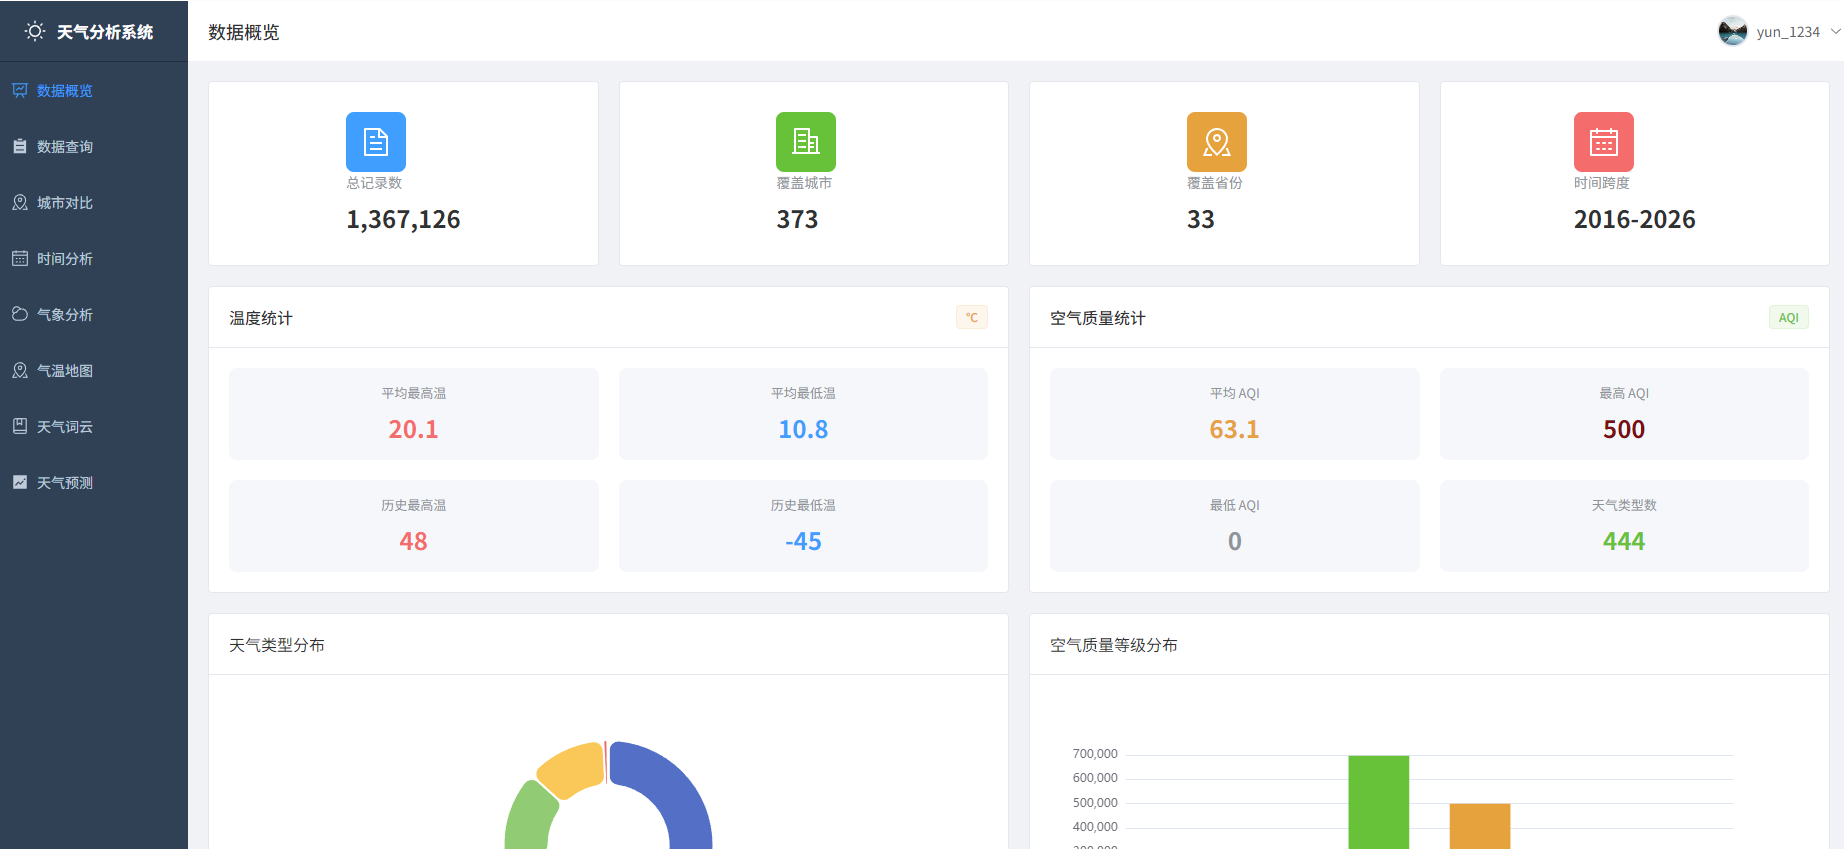
6.1 数据概览页面
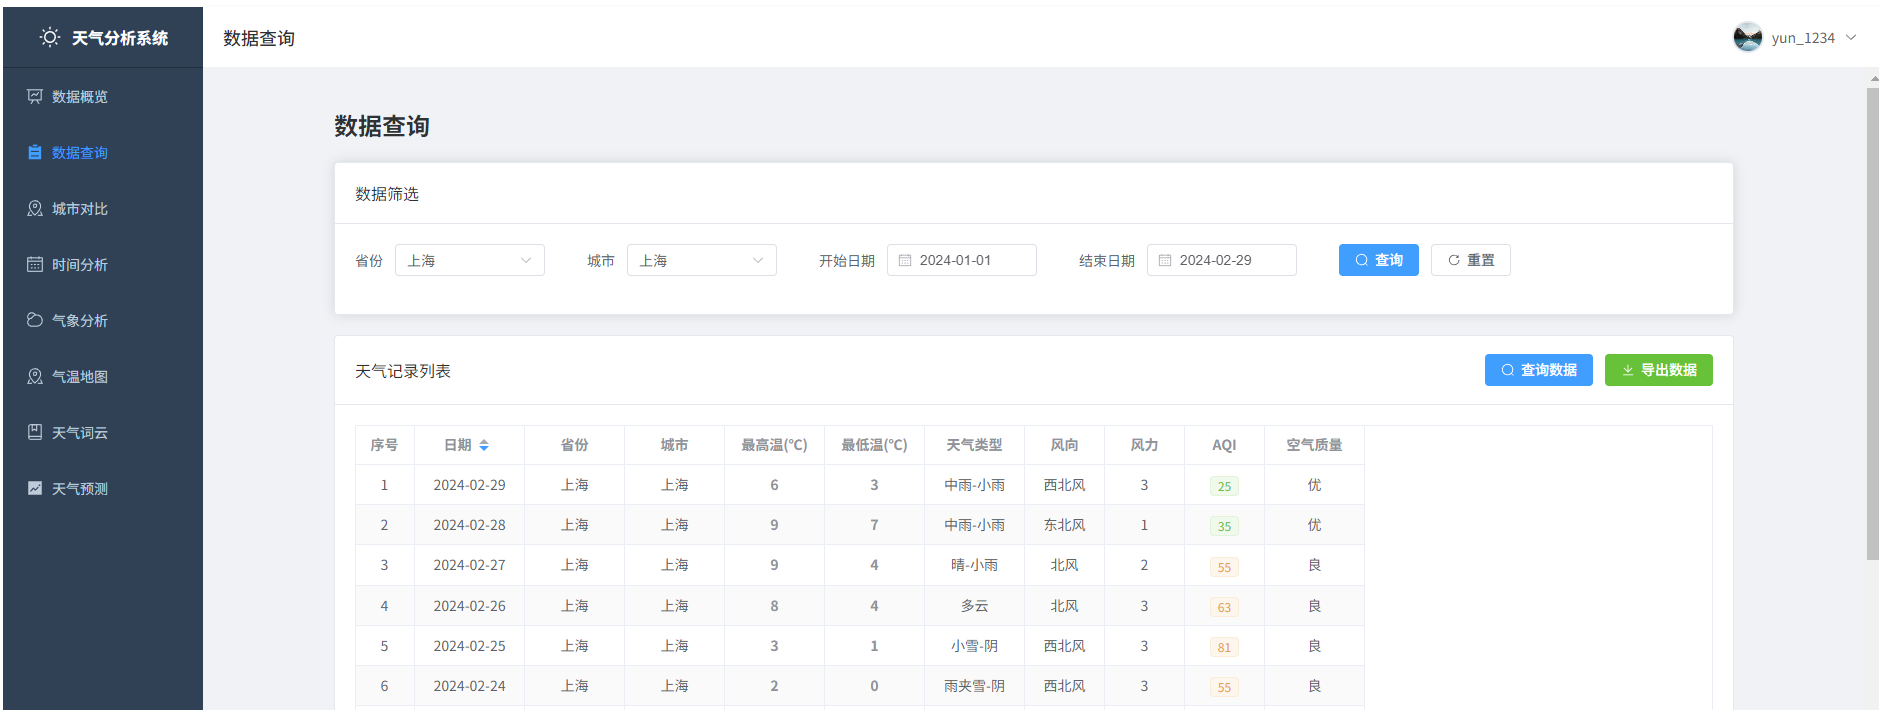
6.2 数据查询页面
6.3 时间分析页面
。
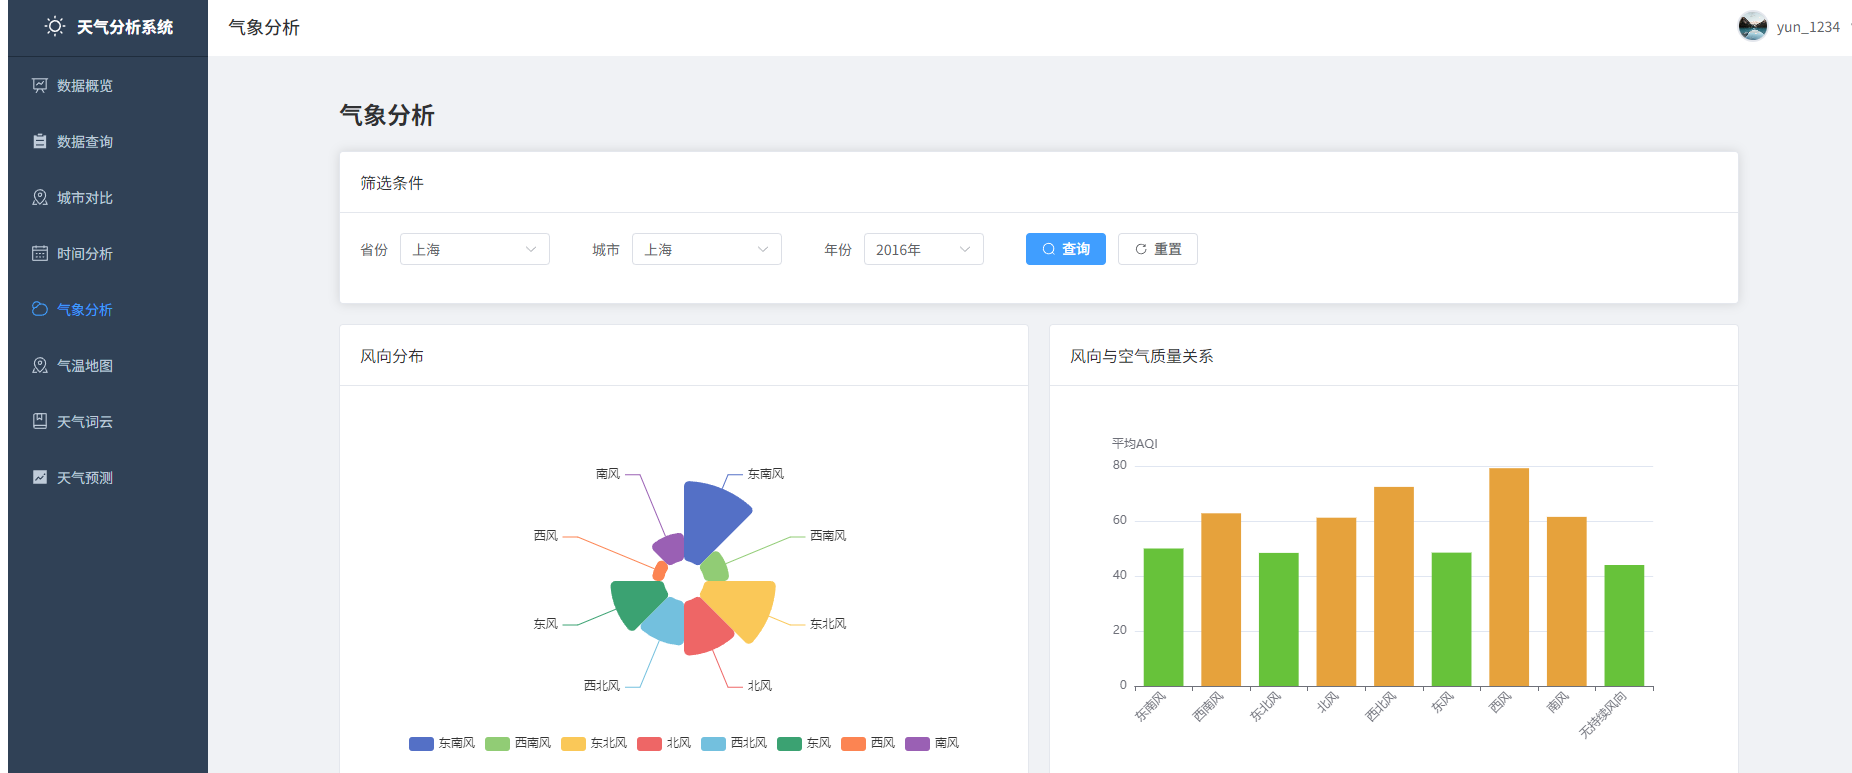
6.4 气象分析页面
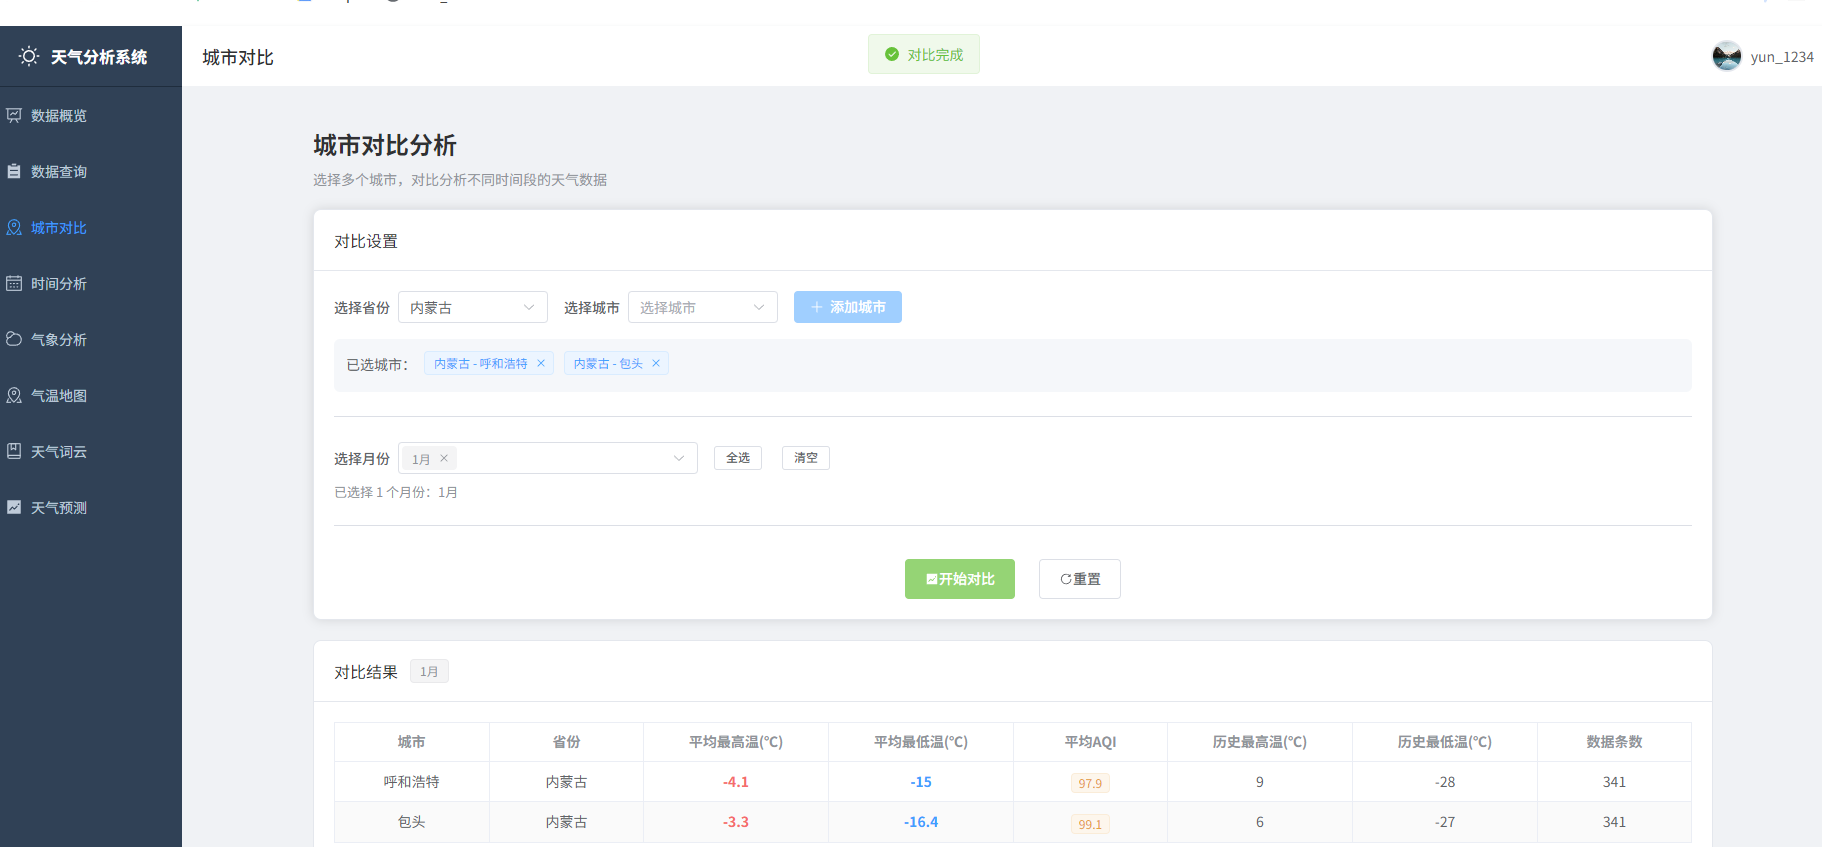
6.5 城市对比页面
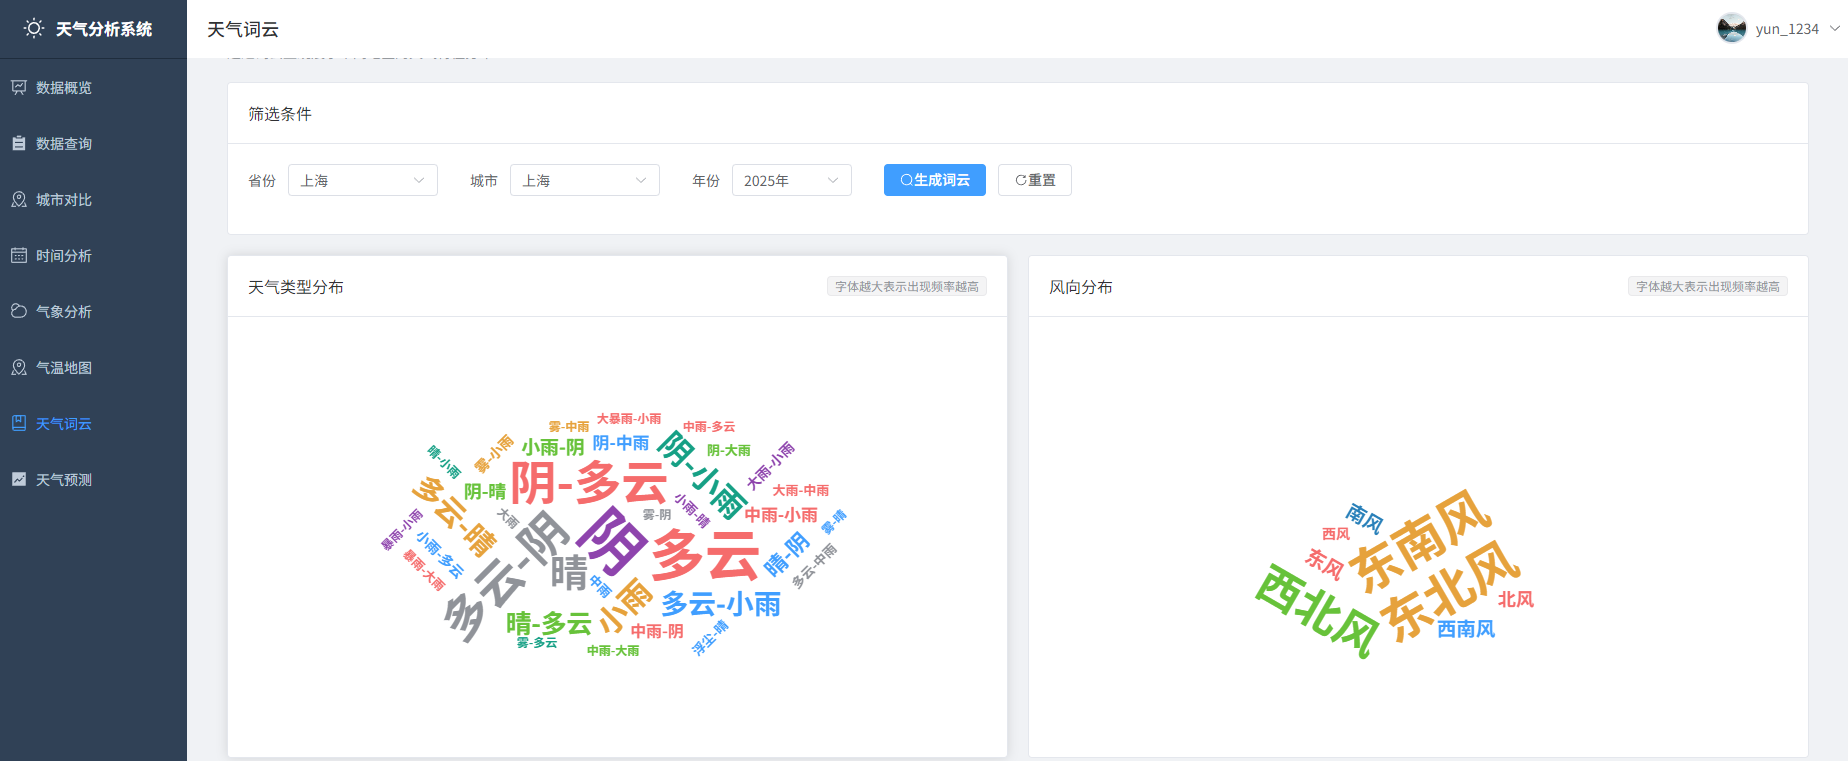
6.7 词云图页面
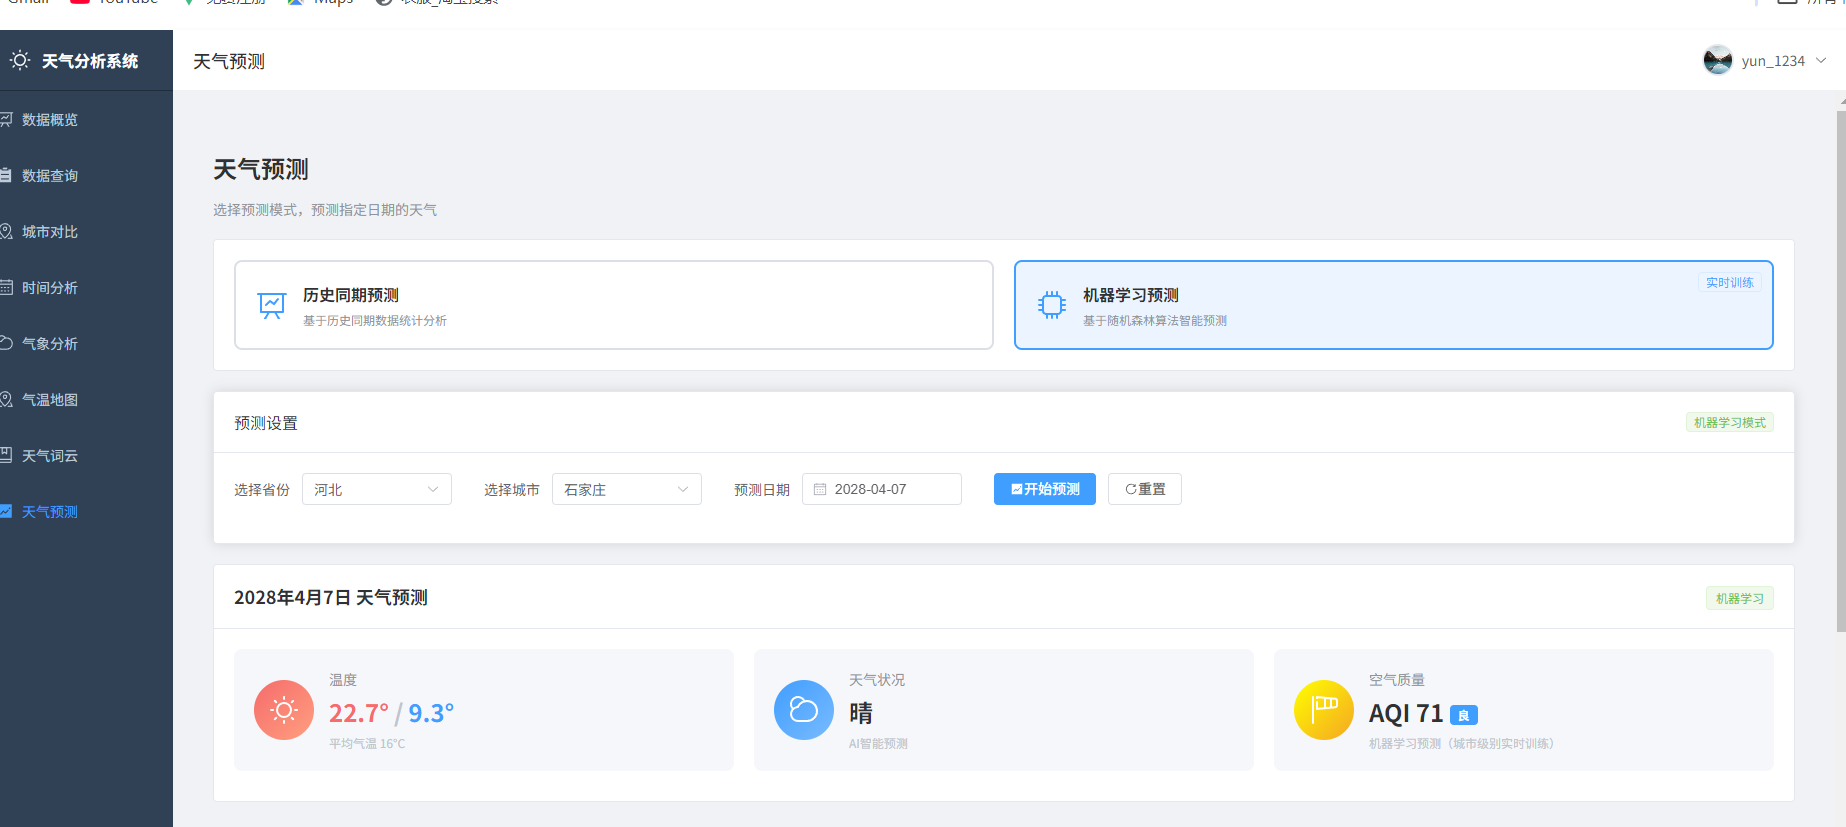
6.8 天气预测
七、项目部署
7.1 后端部署
# 1. 安装依赖
cd backend
pip install -r requirements.txt

# 2. 配置环境变量
cp .env.example .env
# 编辑 .env 文件,配置数据库连接

# 3. 启动服务
python run.py
7.2 前端部署
# 1. 安装依赖
cd frontend/weather-frontend
npm install

# 2. 开发模式
npm run dev
8.3 数据库初始化
cd spider
python 数据更新入库.py --mode clear_and_import

小龙虾开发者社区是 CSDN 旗下专注 OpenClaw 生态的官方阵地,聚焦技能开发、插件实践与部署教程,为开发者提供可直接落地的方案、工具与交流平台,助力高效构建与落地 AI 应用
更多推荐


 13
13 0
0- 0


 已为社区贡献1条内容

所有评论(0)