武汉加油——传染病模型概念与仿真
·
武汉加油——传染病模型概念与仿真
SI模型
SIS模型


SIR模型

SIER模型与改良SIER模型

仿真
global alpha beta r gamma N r2 beta2
N=1400;%1400050000;
r=5;%每个感染者每日接触平均人数
gamma=25/198;%治愈率

%%%%%%%%%SI模型%%%%%%%%%%%%%%%%%
options = odeset('MaxStep',0.01,'NonNegative',1:2);
[T,Y] = ode45(@func_SI, [0,50], [1202 198], options);%[T,Y] = solver(odefun,tspan,y0)。
subplot(2,3,1);
plot(T,Y(:,1),'r','LineWidth',2);
hold on;
plot(T,Y(:,2),'k','LineWidth',2);
xlabel('t');
ylabel('people');
title('SI')
legend({'S','I'},'Location','SouthEast');%'southeastoutside'

%%%%%%%%%SIS模型%%%%%%%%%%%
options = odeset('MaxStep',0.01,'NonNegative',1:2);
[T,Y] = ode45(@func_SIS, [0,50], [1202 198], options);%[T,Y] = solver(odefun,tspan,y0)。
subplot(2,3,2);
plot(T,Y(:,1),'r','LineWidth',2);
hold on;
plot(T,Y(:,2),'k','LineWidth',2);
xlabel('t');
ylabel('people');
title('SIS')
legend({'S','I'},'Location','SouthEast');%'southeastoutside'


%%%%%%%%%SIR模型%%%%%%%%%%%%%%%%
options = odeset('MaxStep',0.01,'NonNegative',1:3);
[T,Y] = ode45(@func_SIR, [0,50], [1202 198 0], options);%[T,Y] = solver(odefun,tspan,y0)。
subplot(2,3,3);
plot(T,Y(:,1),'r','LineWidth',2);
hold on;
plot(T,Y(:,2),'k','LineWidth',2);
hold on;
plot(T,Y(:,3),'g','LineWidth',2);

xlabel('t');
ylabel('people');
title('SIR')
legend({'S','I','R'},'Location','SouthEast');%'southeastoutside'

%%%%%%%%%SEIR模型%%%%%%%%%%%%
beta=90/(198-25);%设接触感染者变为潜伏者概率(1.19,67+10=77)%90/(198*5);设医学观察的是接触过病人的
alpha=77/(817+77);%潜伏者发病概率
r2=6;%每个潜伏者每日接触平均人数
beta2=((1739-817)-(922-90))/(817*6);%接触潜伏者变为潜伏者概率((1739-817)*0.8)/(817*6)

options = odeset('MaxStep',0.01,'NonNegative',1:4);
[T,Y] = ode45(@func_SEIR, [0,50], [1202 198 0 817], options);%[T,Y] = solver(odefun,tspan,y0)。
subplot(2,3,4);
plot(T,Y(:,1),'r','LineWidth',2);
hold on;
plot(T,Y(:,2),'k','LineWidth',2);
hold on;
plot(T,Y(:,3),'g','LineWidth',2);
hold on;
plot(T,Y(:,4),'b','LineWidth',2);
xlabel('t');
ylabel('people');
title('SEIR')
legend({'S','I','R','E'},'Location','SouthEast');%'southeastoutside'

%%%%%%%%%改良版SEIR模型%%%%%%%%%%%%
options = odeset('MaxStep',0.01,'NonNegative',1:4);
[T,Y] = ode45(@func_SEIR2, [0,50], [1202 198 0 817], options);%[T,Y] = solver(odefun,tspan,y0)。
subplot(2,3,5);
plot(T,Y(:,1),'r','LineWidth',2);
hold on;
plot(T,Y(:,2),'k','LineWidth',2);
hold on;
plot(T,Y(:,3),'g','LineWidth',2);
hold on;
plot(T,Y(:,4),'b','LineWidth',2);
xlabel('t');
ylabel('people');
title('SEIR2')
legend({'S','I','R','E'},'Location','SouthEast');%'southeastoutside'

function dy=func_SI(t,y)
global r N
beta=77/198;%设接触感染者发病概率(1.19,67+10=77)
S = y(1);
I = y(2);
%x=beta0*(cos(2*pi*tt)*beta1+1);
dS = -r*beta*I*S/N;
dI =  r*beta*I*S/N;
dy=[dS;dI];
end

function dy=func_SIS(t,y)
global r N gamma
beta=77/198;%设接触感染者发病概率(1.19,67+10=77)
S = y(1);
I = y(2);
%x=beta0*(cos(2*pi*tt)*beta1+1);
dS = -r*beta*I*S/N+gamma*I;
dI =  r*beta*I*S/N-gamma*I;
dy=[dS;dI];
end

function dy=func_SIR(t,y)
global r N gamma
beta=77/198;%设接触感染者发病概率(1.19,67+10=77)
S = y(1);
I = y(2);
R = y(3);
%x=beta0*(cos(2*pi*tt)*beta1+1);
dS = -r*beta*I*S/N;
dI =  r*beta*I*S/N-gamma*I;
dR = gamma*I;
dy=[dS;dI;dR];
end

function dy=func_SEIR(t,y)
global r beta N gamma alpha
S = y(1);
I = y(2);
R = y(3);
E = y(4);
%x=beta0*(cos(2*pi*tt)*beta1+1);
dS = -r*beta*I*S/N;
dE = r*beta*I*S/N-alpha*E;
dI = alpha*E-gamma*I;
dR = gamma*I;
dy=[dS;dI;dR;dE];
end

function dy=func_SEIR2(t,y)
global r beta N gamma alpha r2 beta2
S = y(1);
I = y(2);
R = y(3);
E = y(4);
%x=beta0*(cos(2*pi*tt)*beta1+1);
dS = -r*beta*I*S/N-r2*beta2*E*S/N;
dE = r*beta*I*S/N-alpha*E+r2*beta2*E*S/N;
dI = alpha*E-gamma*I;
dR = gamma*I;
dy=[dS;dI;dR;dE];
end
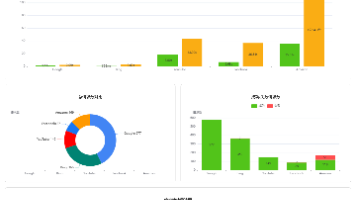
仿真结果


为武汉地区的开发者提供学习、交流和合作的平台。社区聚集了众多技术爱好者和专业人士,涵盖了多个领域,包括人工智能、大数据、云计算、区块链等。社区定期举办技术分享、培训和活动,为开发者提供更多的学习和交流机会。
更多推荐


 13
13 0
0- 0


 已为社区贡献1条内容

所有评论(0)