隐马尔科夫模型 使用(下)
# !/usr/bin/python# -*- coding:utf-8 -*-import numpy as npfrom hmmlearn import hmmimport matplotlib.pyplot as pltimport matplotlib as mplfrom sklearn.metrics.pairwise import pairwise_distances_...
·
# !/usr/bin/python
# -*- coding:utf-8 -*-
import numpy as np
from hmmlearn import hmm
import matplotlib.pyplot as plt
import matplotlib as mpl
from sklearn.metrics.pairwise import pairwise_distances_argmin
import warnings
def expand(a, b):
d = (b - a) * 0.05
return a-d, b+d
if __name__ == "__main__":
warnings.filterwarnings("ignore") # hmmlearn(0.2.0) < sklearn(0.18)
np.random.seed(0)
n = 5 # 隐状态数目
n_samples = 1000
pi = np.random.rand(n)
pi /= pi.sum()
print('初始概率:', pi)
A = np.random.rand(n, n)
mask = np.zeros((n, n), dtype=np.bool)
mask[0][1] = mask[0][4] = True
mask[1][0] = mask[1][2] = True
mask[2][1] = mask[2][3] = True
mask[3][2] = mask[3][4] = True
mask[4][0] = mask[4][3] = True
A[mask] = 0
for i in range(n):
A[i] /= A[i].sum()
print('转移概率:\n', A)
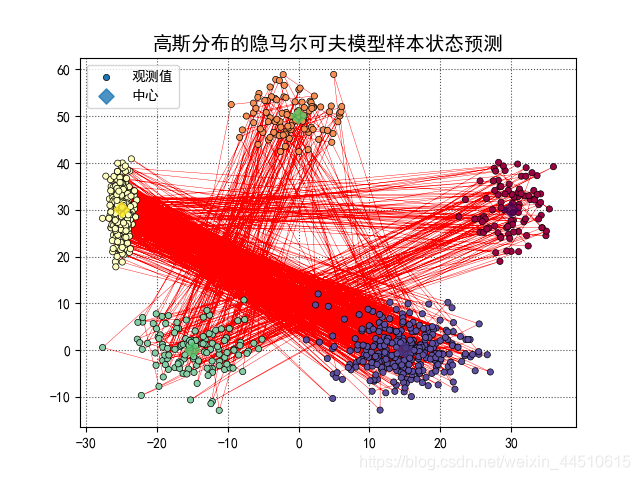
means = np.array(((30, 30), (0, 50), (-25, 30), (-15, 0), (15, 0)))
print('均值:\n', means)
covars = np.empty((n, 2, 2))
for i in range(n):
# covars[i] = np.diag(np.random.randint(1, 5, size=2))
covars[i] = np.diag(np.random.rand(2)+0.001)*30 # np.random.rand ∈[0,1)
print('方差:\n', covars)
model = hmm.GaussianHMM(n_components=n, covariance_type='full')
model.startprob_ = pi
model.transmat_ = A
model.means_ = means
model.covars_ = covars
sample, labels = model.sample(n_samples=n_samples, random_state=0)
# 估计参数
model = hmm.GaussianHMM(n_components=n, covariance_type='full', n_iter=10)
model = model.fit(sample)
y = model.predict(sample)
np.set_printoptions(suppress=True)
print('##估计初始概率:', model.startprob_)
print('##估计转移概率:\n', model.transmat_)
print('##估计均值:\n', model.means_)
print('##估计方差:\n', model.covars_)
# 类别
order = pairwise_distances_argmin(means, model.means_, metric='euclidean')
print(order)
pi_hat = model.startprob_[order]
A_hat = model.transmat_[order]
A_hat = A_hat[:, order]
means_hat = model.means_[order]
covars_hat = model.covars_[order]
change = np.empty((n, n_samples), dtype=np.bool)
for i in range(n):
change[i] = y == order[i]
for i in range(n):
y[change[i]] = i
print('估计初始概率:', pi_hat)
print('估计转移概率:\n', A_hat)
print('估计均值:\n', means_hat)
print('估计方差:\n', covars_hat)
print(labels)
print(y)
acc = np.mean(labels == y) * 100
print('准确率:%.2f%%' % acc)
mpl.rcParams['font.sans-serif'] = ['SimHei']
mpl.rcParams['axes.unicode_minus'] = False
plt.scatter(sample[:, 0], sample[:, 1], s=20, c=labels, cmap=plt.cm.Spectral, marker='o', edgecolors='k',
label='观测值', linewidths=0.5, zorder=20)
plt.plot(sample[:, 0], sample[:, 1], 'r-', zorder=10, lw=0.3)
plt.scatter(means[:, 0], means[:, 1], s=60, c=np.random.rand(n), marker='D', label='中心', alpha=0.8, zorder=30)
x1_min, x1_max = sample[:, 0].min(), sample[:, 0].max()
x2_min, x2_max = sample[:, 1].min(), sample[:, 1].max()
x1_min, x1_max = expand(x1_min, x1_max)
x2_min, x2_max = expand(x2_min, x2_max)
plt.xlim((x1_min, x1_max))
plt.ylim((x2_min, x2_max))
plt.legend(loc='upper left')
plt.grid(True, ls=':', color='#505050')
plt.title('高斯分布的隐马尔可夫模型样本状态预测', fontsize=14)
plt.show()
# !/usr/bin/python
# -*- coding:utf-8 -*-
import numpy as np
from hmmlearn import hmm
import matplotlib.pyplot as plt
import matplotlib as mpl
# from sklearn.metrics.pairwise import pairwise_distances_argmin
import warnings
def expand(a, b):
d = (b - a) * 0.05
return a-d, b+d
if __name__ == "__main__":
warnings.filterwarnings("ignore") # hmmlearn(0.2.0) < sklearn(0.18)
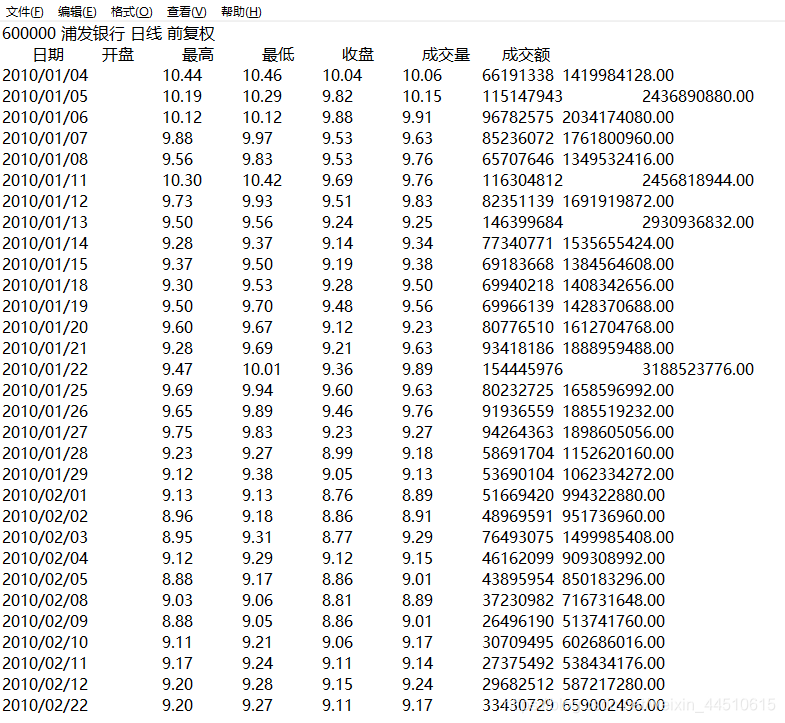
# 0日期 1开盘 2最高 3最低 4收盘 5成交量 6成交额
x = np.loadtxt('SH600000.txt', delimiter='\t', skiprows=2, usecols=(4, 5, 6, 2, 3))
close_price = x[:, 0]
volumn = x[:, 1]
amount = x[:, 2]
amplitude_price = x[:, 3] - x[:, 4] # 每天的最高价与最低价的差
diff_price = np.diff(close_price) # 涨跌值
volumn = volumn[1:] # 成交量
amount = amount[1:] # 成交额
amplitude_price = amplitude_price[1:] # 每日振幅
sample = np.column_stack((diff_price, volumn, amount, amplitude_price)) # 观测值
n = 5
model = hmm.GaussianHMM(n_components=n, covariance_type='full')
model.fit(sample)
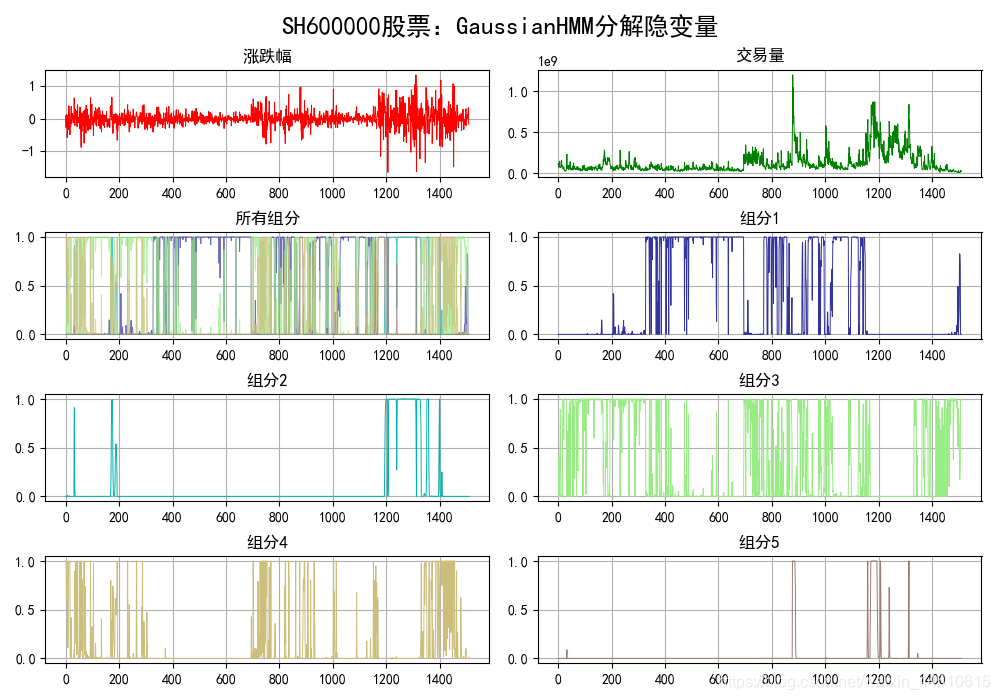
y = model.predict_proba(sample)
np.set_printoptions(suppress=True)
print(y)
t = np.arange(len(diff_price))
mpl.rcParams['font.sans-serif'] = ['SimHei']
mpl.rcParams['axes.unicode_minus'] = False
plt.figure(figsize=(10,7), facecolor='w')
plt.subplot(421)
plt.plot(t, diff_price, 'r-', lw=0.7)
plt.grid(True)
plt.title('涨跌幅')
plt.subplot(422)
plt.plot(t, volumn, 'g-', lw=0.7)
plt.grid(True)
plt.title('交易量')
clrs = plt.cm.terrain(np.linspace(0, 0.8, n))
plt.subplot(423)
for i, clr in enumerate(clrs):
plt.plot(t, y[:, i], '-', color=clr, alpha=0.7, lw=0.7)
plt.title('所有组分')
plt.grid(True)
for i, clr in enumerate(clrs):
axes = plt.subplot(4, 2, i+4)
plt.plot(t, y[:, i], '-', color=clr, lw=0.7)
plt.title('组分%d' % (i+1))
plt.grid(True)
plt.suptitle('SH600000股票:GaussianHMM分解隐变量', fontsize=18)
plt.tight_layout()
plt.subplots_adjust(top=0.9)
plt.show()
点击阅读全文

CSDN联合极客时间,共同打造面向开发者的精品内容学习社区,助力成长!
更多推荐


 1
1 0
0- 0


 已为社区贡献14条内容

所有评论(0)