
【目标检测】【数据增广】Data Augmentation For Object Detection
这是一个大佬在github 开源的项目,专门针对“目标检测”的“数据增广”!代码地址:https://github.com/Paperspace/DataAugmentationForObjectDetection博客地址:https://blog.paperspace.com/data-augmentation-for-bounding-boxes/如果我这样侵权了,请联系我删除!!...
这是一个大佬在github 开源的项目,专门针对“目标检测”的“数据增广”!
代码地址:https://github.com/Paperspace/DataAugmentationForObjectDetection
博客地址:https://blog.paperspace.com/data-augmentation-for-bounding-boxes/
如果我这样侵权了,请联系我删除!!!
包含了“boundingbox 旋转,拉升,翻转,平移等数据增广”与Image同步。
from data_aug.data_aug import *
from data_aug.bbox_util import *
import numpy as np
import cv2
import matplotlib.pyplot as plt
import pickle as pkl
%matplotlib inline
Storage Format
First things first, we define how the storage formats required for images to work.
- The Image: A OpenCV numpy array, of shape (H x W x C). 采用了opencv的图像格式
- Annotations: A numpy array of shape N x 5 where N is the number of objects, one represented by each row. 5 columns represent the top-left x-coordinate, top-left y-coordinate, bottom-right x-coordinate, bottom-right y-coordinate, and the class of the object. 这里说的是bbox的数据形式,(x1,y1,x2,y2,c)代表了“左上角,右下角,类别”
Here is an image to aid your imagination.

Whatever format your annotations are present in make sure, you convert them to this format.
For demonstration purposes, we will be using the image above to show the transformations. The image as well as it's annotation has been provided. The annotation is a numpy array in a pickled format.
这里是展示几个例子,1、利用[:,:,::-1] 可以达到把opencv的BGR转换成RGB的目的,因为利用了plt.show进行显示需要RGB格式。2、展示以下bbox的存储format形式
img = cv2.imread("messi.jpg")[:,:,::-1]   #opencv loads images in bgr. the [:,:,::-1] does bgr -> rgb
bboxes = pkl.load(open("messi_ann.pkl", "rb"))

#inspect the bounding boxes
print(bboxes)
[[ 53. 68.0000175 405. 478.9998225 0. ]
[202. 20.99992 496. 486.99978 0. ]
[589. 77.0001275 737. 335.9999825 0. ]
[723. 327.000125 793. 396.000295 1. ]]
You can use the function draw_rect to plot the bounding boxes on an image.
这里的意思是“draw_rect”作者提供了这个函数去把bbox画在img上,然后可以显示出来
plotted_img = draw_rect(img, bboxes)
plt.imshow(plotted_img)
plt.show()
Now, we can get started with our image augmentations. The first one is Horizontal Flipping. The function takes one arguement, pwhich is the probability that the image will be flipped
这里将会站是一个水平翻转的例子(作者的代码提供了水平翻转,与随机水平翻转)当然也可以自己写成随机水平翻转
img_, bboxes_ = RandomHorizontalFlip(1)(img.copy(), bboxes.copy())
plotted_img = draw_rect(img_, bboxes_)
plt.imshow(plotted_img)
plt.show()
Scaling. Scales the image. If the argument diff is True, then the image is scaled with different values in the vertical and the horizontal directions, i.e. aspect ratio is not maintained.
If the first argument is a float, then the scaling factors for both x and y directions are randomly sampled from (- arg, arg). Otherwise, you can specify a tuple for this range.
展示关于“尺度变换”的例子,这里的话涉及到物品会跑出图像,比如足球不见了,还有蓝色衣服的球员,几乎跑出了镜头,这样也可以起到增加困难样本的一个目的!!!
img_, bboxes_ = RandomScale(0.3, diff = True)(img.copy(), bboxes.copy())
plotted_img = draw_rect(img_, bboxes_)
plt.imshow(plotted_img)
plt.show()
Translation. Translates the image. If the argument diff is True, then the image is translated with different values in the vertical and the horizontal directions.
If the first argument is a float, then the translating factors for both x and y directions are randomly sampled from (- arg, arg). Otherwise, you can specify a tuple for this range.
平移变换
img_, bboxes_ = RandomTranslate(0.3, diff = True)(img.copy(), bboxes.copy())
plotted_img = draw_rect(img_, bboxes_)
plt.imshow(plotted_img)
plt.show()
Rotation. Rotates the image.
If the first argument is a int, then the rotating angle, in degrees, is sampled from (- arg, arg). Otherwise, you can specify a tuple for this range.
旋转变换,这里的话主要难度在于bbox,同时也会让bbox存在一定的空隙,不能紧贴目标!!!
img_, bboxes_ = RandomRotate(20)(img.copy(), bboxes.copy())
plotted_img = draw_rect(img_, bboxes_)
plt.imshow(plotted_img)
plt.show()
Shearing. Sheares the image horizontally
If the first argument is a float, then the shearing factor is sampled from (- arg, arg). Otherwise, you can specify a tuple for this range.
有一种改变视角的感觉,不是很清楚这个shearing具体是什么意思,有知道的老铁,麻烦说下,谢谢!!!
img_, bboxes_ = RandomShear(0.2)(img.copy(), bboxes.copy())
plotted_img = draw_rect(img_, bboxes_)
plt.imshow(plotted_img)
plt.show()
Resizing. Resizes the image to square dimensions while keeping the aspect ratio constant.
The argument to this augmentation is the side of the square.
基本的resize以及涉及到padding之类!
img_, bboxes_ = Resize(608)(img.copy(), bboxes.copy())
plotted_img = draw_rect(img_, bboxes_)
plt.imshow(plotted_img)
plt.show()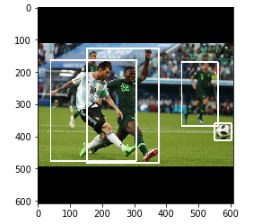
HSV transforms are supported as well.
颜色变化,比如来模拟天气变化,亮暗程度,等等!
img_, bboxes_ = RandomHSV(100, 100, 100)(img.copy(), bboxes.copy())
plotted_img = draw_rect(img_, bboxes_)
plt.imshow(plotted_img)
plt.show()
You can combine multiple transforms together by using the Sequence class as follows.
给出一个整合以上部分变换的例子!
seq = Sequence([RandomHSV(40, 40, 30),RandomHorizontalFlip(), RandomScale(), RandomTranslate(), RandomRotate(10), RandomShear()])
img_, bboxes_ = seq(img.copy(), bboxes.copy())

plotted_img = draw_rect(img_, bboxes_)
plt.imshow(plotted_img)
plt.show()
这个风格很符合,我们用的Pytorch框架以及MXnet等一些框架,也有些人喜欢bbox种没有c这一项,也很好改,我自己改过,很方便能和pytorch结合,pytorch就算是dataload采用了PIL的Image读入也是可以的,要么转换成numpy要么把这个项目改成PIL的!都蛮方便的

旨在为数千万中国开发者提供一个无缝且高效的云端环境,以支持学习、使用和贡献开源项目。
更多推荐


 2
2 0
0- 0


 已为社区贡献5条内容

所有评论(0)