
python matplotlib如何将图例放在图外
关于matplotlib如何设置图例的位置?如何将图例放在图外?以及如何在一幅图有多个子图的情况下,删除重复的图例?我用一个简单的例子说明一下。import pandas as pdimport numpy as npimport matplotlib.pyplot as pltfig = plt.figure(1)ax1 = fig.add_subplot(2,2,1)ax2 = fig.
关于matplotlib如何设置图例的位置?如何将图例放在图外?以及如何在一幅图有多个子图的情况下,删除重复的图例?我用一个简单的例子说明一下。
import pandas as pd
import numpy as np
import matplotlib.pyplot as plt

fig = plt.figure(1)
ax1 = fig.add_subplot(2,2,1)
ax2 = fig.add_subplot(2,2,2)
ax3 = fig.add_subplot(2,2,3)
ax4 = fig.add_subplot(2,2,4)

df1 = pd.DataFrame(np.random.randn(3,5),columns = ['one','two','three','four','five'])
df2 = pd.DataFrame(np.random.randn(3,5),columns = ['one','two','three','four','five'])
df3 = pd.DataFrame(np.random.randn(3,5),columns = ['one','two','three','four','five'])
df4 = pd.DataFrame(np.random.randn(3,5),columns = ['one','two','three','four','five'])


df1.plot(ax = ax1, title = "df1", grid = 'on')
df2.plot(ax = ax2, title = "df1", grid = 'on')
df3.plot(ax = ax3, title = "df1", grid = 'on')
df4.plot(ax = ax4, title = "df1", grid = 'on')

plt.show()
运行结果如下
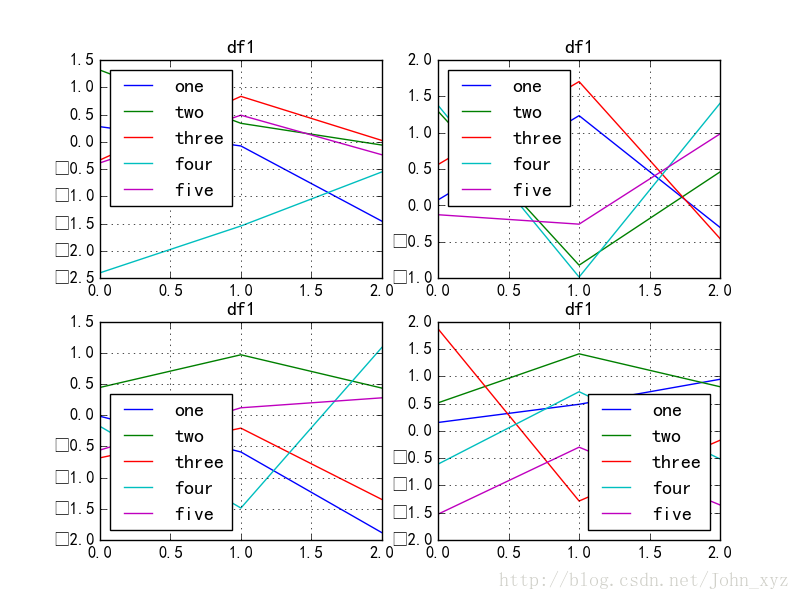
可以看出,随机生成了几个dataframe,在一个figure()中生成了四个子图,每个子图的图例都是dataframe.columns里的值,那么如何移除这些图例?
import pandas as pd
import numpy as np
import matplotlib.pyplot as plt

fig = plt.figure(1)
ax1 = fig.add_subplot(2,2,1)
ax2 = fig.add_subplot(2,2,2)
ax3 = fig.add_subplot(2,2,3)
ax4 = fig.add_subplot(2,2,4)

df1 = pd.DataFrame(np.random.randn(3,5),columns = ['one','two','three','four','five'])
df2 = pd.DataFrame(np.random.randn(3,5),columns = ['one','two','three','four','five'])
df3 = pd.DataFrame(np.random.randn(3,5),columns = ['one','two','three','four','five'])
df4 = pd.DataFrame(np.random.randn(3,5),columns = ['one','two','three','four','five'])


df1.plot(ax = ax1, title = "df1", grid = 'on')
df2.plot(ax = ax2, title = "df1", grid = 'on')
df3.plot(ax = ax3, title = "df1", grid = 'on')
df4.plot(ax = ax4, title = "df1", grid = 'on')

ax1.legend_.remove()        ##移除子图ax1中的图例
ax2.legend_.remove()        ##移除子图ax2中的图例
ax3.legend_.remove()        ##移除子图ax3中的图例


plt.show()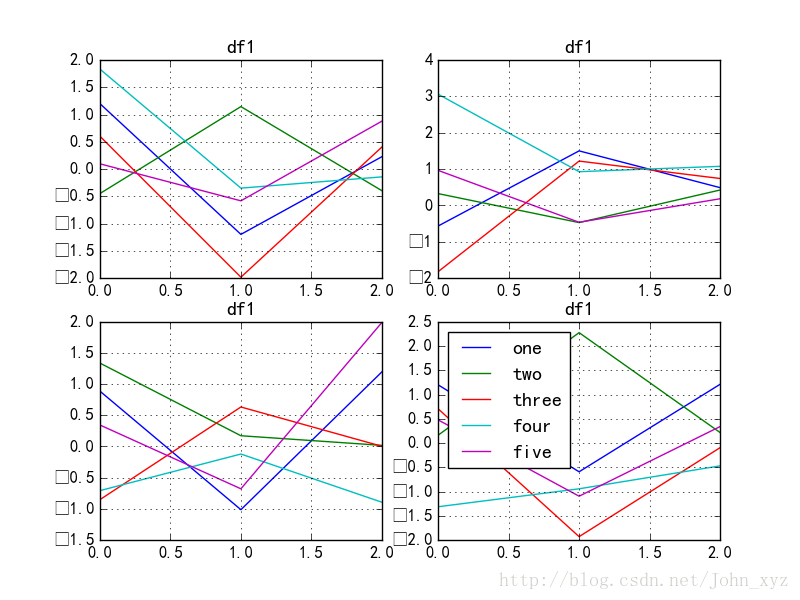
可以看出ax1,ax2,ax3中的图例都被移除了,但是上图还不是很美观?有没有什么办法将图例放到图外面呢?请看:
import pandas as pd
import numpy as np
import matplotlib.pyplot as plt

fig = plt.figure(1)
ax1 = fig.add_subplot(2,2,1)
ax2 = fig.add_subplot(2,2,2)
ax3 = fig.add_subplot(2,2,3)
ax4 = fig.add_subplot(2,2,4)

df1 = pd.DataFrame(np.random.randn(3,5),columns = ['one','two','three','four','five'])
df2 = pd.DataFrame(np.random.randn(3,5),columns = ['one','two','three','four','five'])
df3 = pd.DataFrame(np.random.randn(3,5),columns = ['one','two','three','four','five'])
df4 = pd.DataFrame(np.random.randn(3,5),columns = ['one','two','three','four','five'])


df1.plot(ax = ax1, title = "df1", grid = 'on')
df2.plot(ax = ax2, title = "df1", grid = 'on')
df3.plot(ax = ax3, title = "df1", grid = 'on')
df4.plot(ax = ax4, title = "df1", grid = 'on')

ax1.legend_.remove()
ax2.legend_.remove()
ax3.legend_.remove()
ax4.legend(loc=2, bbox_to_anchor=(1.05,1.0),borderaxespad = 0.)     ##设置ax4中legend的位置,将其放在图外

plt.show()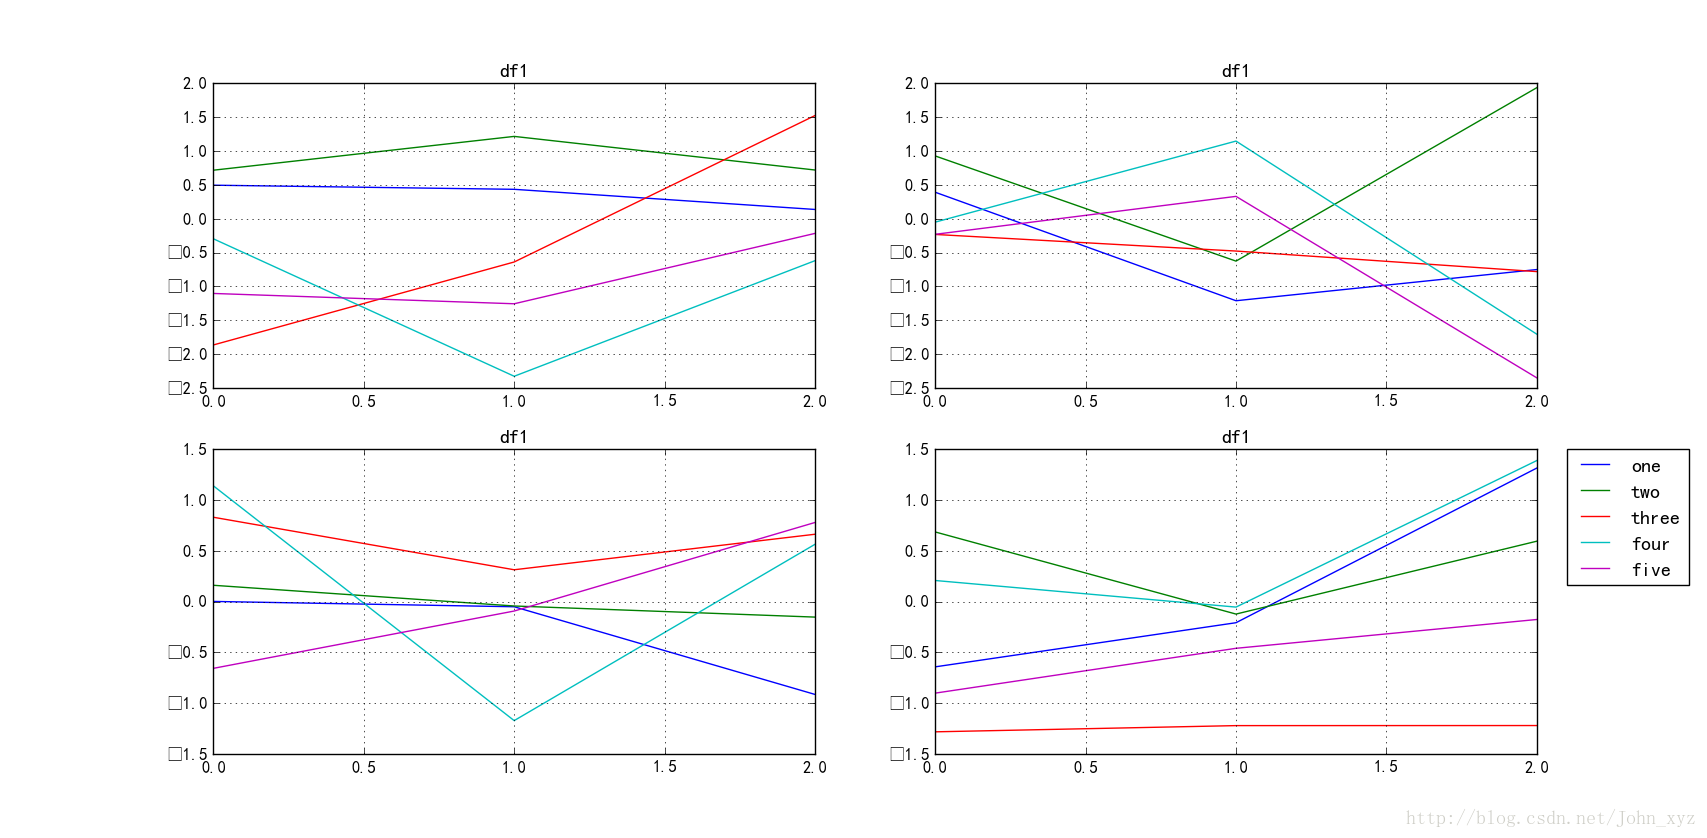
其中参数loc用于设置legend的位置
bbox_to_anchor用于在bbox_transform坐标(默认轴坐标)中为图例指定任意位置。
关于plt.legend更多的参数信息,详细见官方文档:http://matplotlib.org/api/pyplot_api.html#matplotlib.pyplot.legend
关于legend的官方教程:详细见:http://matplotlib.org/users/legend_guide.html
关于pandas.DataFrame.plot更多的作图问题,详细见:http://pandas.pydata.org/pandas-docs/stable/generated/pandas.DataFrame.plot.html

旨在为数千万中国开发者提供一个无缝且高效的云端环境,以支持学习、使用和贡献开源项目。
更多推荐


 43
43 0
0- 0


 已为社区贡献1条内容

所有评论(0)