
intel pin 插桩工具入门
Intel Pin 是一种动态二进制插桩(DBI)工具,它允许用户在不修改源代码的情况下,对程序进行插桩和分析。插桩是指向程序中插入额外的代码,以便监视程序的执行、收集数据或修改程序的行为。Intel Pin 可以用于各种用途,包括性能分析、代码覆盖率分析、安全漏洞检测、软件调试等。通过插桩工具,开发人员可以获得对程序运行时行为的深入了解,而无需修改程序的源代码。性能分析:可以插入代码来跟踪函数调
一、pin的介绍(偷懒,来自chatgpt)
Intel Pin 是一种动态二进制插桩(DBI)工具,它允许用户在不修改源代码的情况下,对程序进行插桩和分析。插桩是指向程序中插入额外的代码,以便监视程序的执行、收集数据或修改程序的行为。
Intel Pin 可以用于各种用途,包括性能分析、代码覆盖率分析、安全漏洞检测、软件调试等。通过插桩工具,开发人员可以获得对程序运行时行为的深入了解,而无需修改程序的源代码。
就比如:我可以不修改ls指令,就知道ls指令总共执行了多少条机器指令,我可以不修改我的可执行文件,就通过pin得知该可执行文件,执行过程总共有多少次访存操作、多少次系统调用,等等
Intel Pin 主要用途包括:
-
性能分析:可以插入代码来跟踪函数调用、内存访问、指令执行等,从而进行性能分析和优化。
-
安全分析:可以用于检测程序中的安全漏洞、漏洞利用、恶意行为等,有助于提高软件的安全性。
-
代码覆盖率分析:可以插入代码来跟踪程序执行过程中哪些代码被执行,用于代码覆盖率分析和测试覆盖率评估。
-
软件调试:可以插入代码以捕获程序的状态、变量值等信息,用于软件调试和问题定位。
二、pin的下载和使用(针对linux)
下载后解压,将解压后的文件夹移动到要安装的位置即可。
使用方式为
<pin安装的目录>/pin -t 工具名.so -- 可执行文件这样就可以使用写好的工具,对要分析的可执行文件进行分析了。
三、pin分析工具如何写
pin工具编写模式总结
对pin分析工具代码的编写模式进行总结,大致是如下这个样子
//pin工具的头文件
#include "pin.H"

//用来注册的各种函数
// 函数1
VOID Instruction(INS ins, VOID* v)
{
    xxxxxxxx
}

// 函数2
VOID Fini(INT32 code, VOID* v)
{
    xxxxx
}

int main(int argc, char* argv[])
{
    //pin初始化
    PIN_Init(argc, argv);

    //注册各种函数
    // 注册,使待分析可执行文件,每条指令执行前,都会运行一遍Instruction函数
    INS_AddInstrumentFunction(Instruction, 0);

    // 注册,使得分析结束后,运行Fini函数
    PIN_AddFiniFunction(Fini, 0);

    // 启动程序的运行
    PIN_StartProgram();
    return 0;
}
一句话总结代码模式就是:main函数里面,进行各种级别的插桩。main函数外面,就是各种用来插桩的函数。
什么是插桩:就是注册,遇到每条指令做什么,遇到每个trace做什么,遇到每个routine做什么
pin工具代码实例分析
/*
 * Copyright (C) 2004-2021 Intel Corporation.
 * SPDX-License-Identifier: MIT
 */

#include <iostream>
#include <fstream>
#include "pin.H"
using std::cerr;
using std::endl;
using std::ios;
using std::ofstream;
using std::string;

ofstream OutFile;

// The running count of instructions is kept here
// make it static to help the compiler optimize docount
static UINT64 icount = 0;

// This function is called before every instruction is executed
VOID docount() { icount++; }

// Pin calls this function every time a new instruction is encountered
VOID Instruction(INS ins, VOID* v)
{
    // Insert a call to docount before every instruction, no arguments are passed
    INS_InsertCall(ins, IPOINT_BEFORE, (AFUNPTR)docount, IARG_END);
}

KNOB< string > KnobOutputFile(KNOB_MODE_WRITEONCE, "pintool", "o", "inscount.out", "specify output file name");

// This function is called when the application exits
VOID Fini(INT32 code, VOID* v)
{
    // Write to a file since cout and cerr maybe closed by the application
    OutFile.setf(ios::showbase);
    OutFile << "Count " << icount << endl;
    OutFile.close();
}

/* ===================================================================== */
/* Print Help Message                                                    */
/* ===================================================================== */

INT32 Usage()
{
    cerr << "This tool counts the number of dynamic instructions executed" << endl;
    cerr << endl << KNOB_BASE::StringKnobSummary() << endl;
    return -1;
}

/* ===================================================================== */
/* Main                                                                  */
/* ===================================================================== */
/*   argc, argv are the entire command line: pin -t <toolname> -- ...    */
/* ===================================================================== */

int main(int argc, char* argv[])
{
    // Initialize pin
    if (PIN_Init(argc, argv)) return Usage();

    OutFile.open(KnobOutputFile.Value().c_str());

    // Register Instruction to be called to instrument instructions
    INS_AddInstrumentFunction(Instruction, 0);

    // Register Fini to be called when the application exits
    PIN_AddFiniFunction(Fini, 0);

    // Start the program, never returns
    PIN_StartProgram();

    return 0;
}
直接从官网教程复制下来的代码
概述这段代码就是
(1)定义一个全局变量icount
(2)注册函数调用,分析状态下,每遇到一条指令,就插桩一个函数(该函数让icount数值加1)
(3)注册结束时的函数,将icount的结果写到目标文件中
(4)好了,开始运行:PIN_StartProgram();
工具中的代码,是在待分析可执行文件运行前,进行各种注册。
注册完之后,运行要分析的可执行文件,每遇到指定的事件,就会运行我们注册好的指定函数;
所以,要分析的可执行文件,运行过程中,每遇到一条指令,就会调用一次docount函数,使icont值加1
而icount值,就是要分析的可执行文件的所有执行指令数。
上面这个案例代码,在目录<install path>/source/tools/ManualExamples下。
通过以下步骤可以查看这个工具的效果
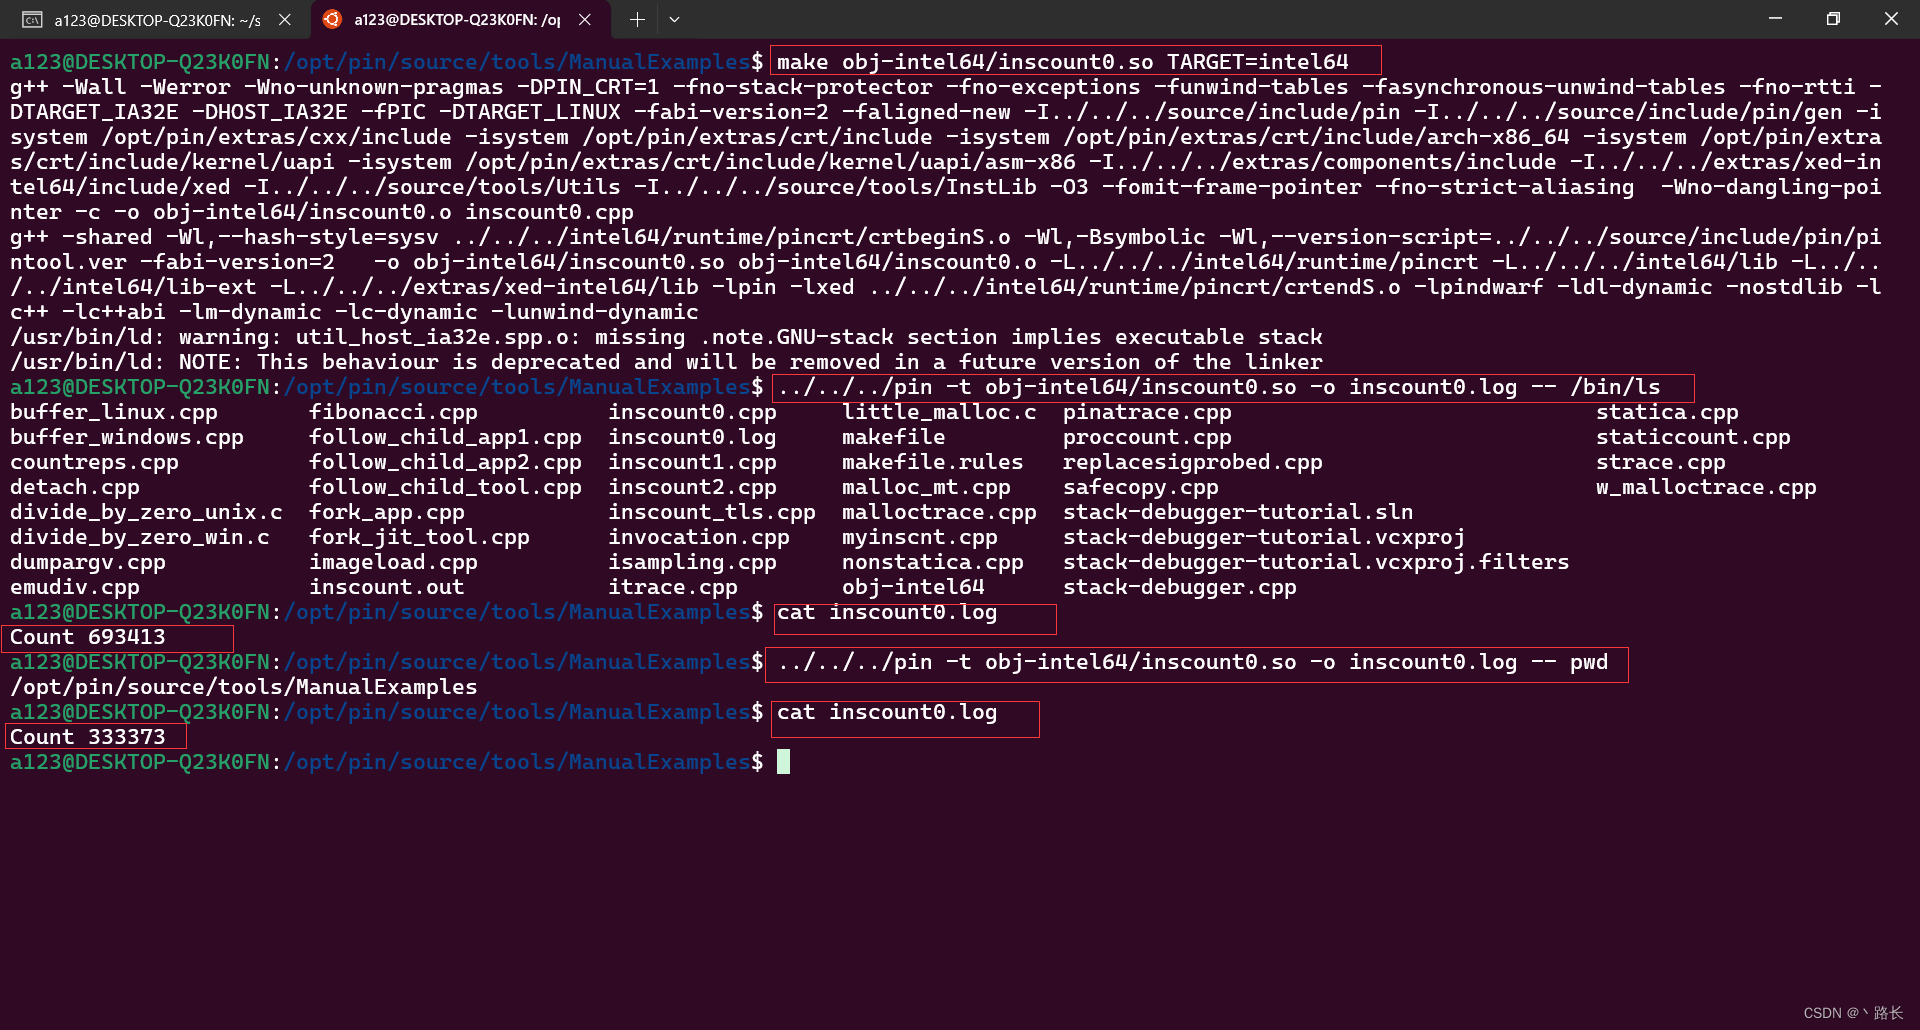
cd <install path>/source/tools/ManualExamplesmake obj-intel64/inscount0.so TARGET=intel64../../../pin -t obj-intel64/inscount0.so -o inscount0.log -- /bin/ls这里我们选择待测可执行文件为/bin/ls,用来测试的可执行文件也可以换成其他的
之后
cat inscount0.log就可以看到我们想测的目标应用程序,总共执行了多少条代码
效果如下:
根据图片可知,ls指令执行了693413条指令,pwd指令执行了333373条指令

旨在为数千万中国开发者提供一个无缝且高效的云端环境,以支持学习、使用和贡献开源项目。
更多推荐


 36
36 0
0- 0


 已为社区贡献1条内容

所有评论(0)