uniapp图表库ucharts双y轴实现方法
移动端ucharts实现双y轴模式图
·
1.首先要设置属性为混合mix模式,这里用到的是ucharts的组件。
<view class="moreline_cavcans">
				<qiun-data-charts type="mix" :opts="opts" :chartData="chartData" />
			</view>
2.其次开始y轴配置属性以及数据。(这里y轴分成了两组数据left代表左边y轴,right代表右边y轴)
	yAxis: {
						gridType: "dash", //横向网格样式  solid实线
						axisLine: false, //坐标轴线是否显示
						axisLineColor: '#fff', //坐标轴颜色
						gridColor: 'rgba(86,94,107,0.4)', //网格颜色
						dashLength: 3, //网格dash宽度
						showTitle: true,
						splitNumber: 4,
						data: [{   //这里y轴分组   left是下标为0的第一组y数据在最左侧
								position: "left",
								axisLine: false, //坐标轴轴线是否显示
								axisLineColor: '#fff', //坐标轴轴线颜色
								fontColor: "#474e5b",
								fontSize: 14,
								disabled: false, //是否绘画y轴  true不 默认为false
								min: 0, //y轴最小值
								max: 8000, //y轴最大值   最大值来除以y轴显示的数量=每份的数量
								// unit:'焦',//y轴刻度后面的单位
								tofix: 2,
								title: '套数(套)',
								titleOffsetY: -6,
								titleOffsetX: -6,
							},
							{//这里y轴分组   right是下标为1的第二组y数据在最右侧
								position: "right",
								axisLine: false, //坐标轴轴线是否显示
								axisLineColor: '#fff', //坐标轴轴线颜色
								fontColor: "#474e5b",
								fontSize: 14,
								disabled: false, //是否绘画y轴  true不 默认为false
								min: 0, //y轴最小值
								max: 600, //y轴最大值   最大值来除以y轴显示的数量=每份的数量
								// unit:'焦',//y轴刻度后面的单位
								tofix: 2,
								title: '面积万/m2',
								titleOffsetY: -6,
								titleOffsetX: 10,
							},
						]
					},
3.最重要的是在数据series里要对应这个y轴下标数组。
setTimeout(() => {
					//模拟服务器返回数据,如果数据格式和标准格式不同,需自行按下面的格式拼接
					let res = {
						categories: this.categories,
						series: [{
								name: "销售面积",
								type: "line",
								index: 1,//这个是重点  0代表第一组y轴坐标数据,1代表第二组y轴坐标数据
								legendShape: 'circle',
								data: [220, 240, 501, 390, 440, 520]
							},
							{
								name: "上市面积",
								type: "line",
								index: 1,
								legendShape: 'circle',
								data: [350, 200, 450, 480, 460, 560]
							},
							{
								name: "销售套数",
								legendShape: 'circle',
								type: "line",
								data: [1200, 1500, 2100, 2600, 3000, 4500]
							}
						],
					};
					this.chartData = JSON.parse(JSON.stringify(res));
				}, 500);
4.具体整页代码如下,仅供参考。(首先必须引入ucharts图表库插件,可看我其他文章有介绍哦 )
)
<template>
<view class="container">
<!-- 多折线图 -->
<view class="aside_inner">
<view class="moreline_title">
{{moreline_title}}
</view>
<view class="moreline_cavcans">
<qiun-data-charts type="mix" :opts="opts" :chartData="chartData" />
</view>
</view>
</view>
</template>
<script>
export default {
data() {
return {
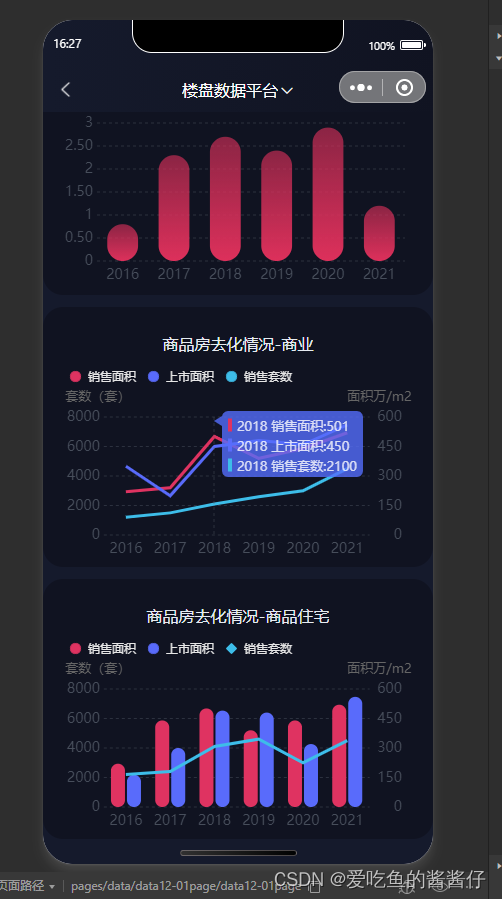
moreline_title: '商品房去化情况-商业',
chartData: {},
categories: ["2016", "2017", "2018", "2019", "2020", "2021"],
opts: {
color: ["#df3361", "#596bfb", "#3dbde9", "#EE6666", "#73C0DE", "#3CA272", "#FC8452", "#9A60B4",
"#ea7ccc"
],
padding: [-10, 10, 30, 15],
dataLabel: false, //是否显示数据文案 true表示显示,false表示不显示
dataPointShape: false, //是否显示数据点数据图表
dataPointShapeType: 'solid', //图形标识点显示类型 solid实心 hollow空心
legend: {
fontColor: '#e6e6e6',
fontSize: 12,
position: "top",
margin: 16,
padding: 5,
float: "left"
},
xAxis: {
disabled: false, //不绘制x轴
axisLine: false, //坐标轴线
axisLineColor: "#fff", //坐标轴线颜色
calibration: false, //刻度线
disableGrid: true, //不绘制网格线
fontColor: "#474e5b", //刻度值字体颜色
fontSize: 14,
},
yAxis: {
gridType: "dash", //横向网格样式 solid实线
axisLine: false, //坐标轴线是否显示
axisLineColor: '#fff', //坐标轴颜色
gridColor: 'rgba(86,94,107,0.4)', //网格颜色
dashLength: 3, //网格dash宽度
showTitle: true,
splitNumber: 4,
data: [{ //这里y轴分组 left是下标为0的第一组y数据在最左侧
position: "left",
axisLine: false, //坐标轴轴线是否显示
axisLineColor: '#fff', //坐标轴轴线颜色
fontColor: "#474e5b",
fontSize: 14,
disabled: false, //是否绘画y轴 true不 默认为false
min: 0, //y轴最小值
max: 8000, //y轴最大值 最大值来除以y轴显示的数量=每份的数量
// unit:'焦',//y轴刻度后面的单位
tofix: 2,
title: '套数(套)',
titleOffsetY: -6,
titleOffsetX: -6,
},
{//这里y轴分组 right是下标为1的第二组y数据在最右侧
position: "right",
axisLine: false, //坐标轴轴线是否显示
axisLineColor: '#fff', //坐标轴轴线颜色
fontColor: "#474e5b",
fontSize: 14,
disabled: false, //是否绘画y轴 true不 默认为false
min: 0, //y轴最小值
max: 600, //y轴最大值 最大值来除以y轴显示的数量=每份的数量
// unit:'焦',//y轴刻度后面的单位
tofix: 2,
title: '面积万/m2',
titleOffsetY: -6,
titleOffsetX: 10,
},
]
},
extra: {
tooltip: {
showArrow: true, //是否显示小三角
// showCategory:true,
gridColor: 'rgba(86,94,107,0.4)',
borderRadius: 6,
bgColor: "#546dfb",
gridType: 'dash', //分割线
dashLength: 3,
bgOpacity: 0.8,
labelBgColor: 'red',
fontColor: 'rgba(255, 255, 255, 0.8)'
},
line: {
type: "straight",
width: 2,
activeType: "hollow"
},
mix: {
line: {
width: 3,
}
}
}
}
};
},
methods: {
getServerData() {
//模拟从服务器获取数据时的延时
setTimeout(() => {
//模拟服务器返回数据,如果数据格式和标准格式不同,需自行按下面的格式拼接
let res = {
categories: this.categories,
series: [{
name: "销售面积",
type: "line",
index: 1,//这个是重点 0代表第一组y轴坐标数据,1代表第二组y轴坐标数据
legendShape: 'circle',
data: [220, 240, 501, 390, 440, 520]
},
{
name: "上市面积",
type: "line",
index: 1,
legendShape: 'circle',
data: [350, 200, 450, 480, 460, 560]
},
{
name: "销售套数",
legendShape: 'circle',
type: "line",
data: [1200, 1500, 2100, 2600, 3000, 4500]
}
],
};
this.chartData = JSON.parse(JSON.stringify(res));
}, 500);
},
},
created() {
this.getServerData();
}
}
</script>
<style lang="scss" scoped>
.aside_inner {
width: 100%;
.moreline_title {
text-align: center;
color: #e6ebf1;
font-size: 32rpx;
padding-top: 50rpx;
font-weight: 500;
}
.moreline_cavcans {
width: 700rpx;
margin: 10rpx;
height: 440rpx;
}
}
</style>
5.废话不多说,来看一下实现效果吧

为开发者提供学习成长、分享交流、生态实践、资源工具等服务,帮助开发者快速成长。
更多推荐


 5
5 0
0- 0


 已为社区贡献21条内容

所有评论(0)