Prometheus+Grafana监控系统
Prometheus(普罗米修斯,有时简称Prom)是由SoundCloud开发的开源监控报警系统和时序数据库 (Time Series Database, TSDB)。Prometheus受Google的Brogmon监控系统的启发(Kubernetes是从Google的Brog系统的启发),从2012年开始由前Google工程师在SoundCloud以开源软件的形式进行研发,并于2015年初对
·
Prometheus+Grafana监控系统
Prometheus介绍
Prometheus简史
- Prometheus(普罗米修斯,有时简称Prom)是由SoundCloud开发的开源监控报警系统和时序数据库 (Time Series Database, TSDB)。
- Prometheus受Google的Brogmon监控系统的启发(Kubernetes是从Google的Brog系统的启发),从2012年开始由前Google工程师在SoundCloud以开源软件的形式进行研发,并于2015年初对外发布早期版本。
- 2016年5月,继Kubernetes之后成为第二个正式加入CNCF基金会的项目,并于同年6月正式发布1.0版本。2017年底发布了基于全新存储层的2.0版本。能够更好的与容器平台、云平台配合。2018年8月,Prometheus成为CNCF历史上第二个“毕业”的项目。
什么是Prometheus?
- Prometheus是一款时序(Time Series)数据库(随时间流逝而不断产生的新的数据点),但它的功能却并
非止步于TSDB,而是一款设计用于进行目标主机( Target )监控的关键组件 - 结合生态系统内的其他组件,如 PushGateway , Altermanager 和 Grafana 等,可以构成一个
完整的IT监控系统
什么是时序数据
- 时序数据,是在一段时间内通过重复测量( measurement )而获得的观测值的集合,将这些观测值绘
制于图形之上,会有一个数据轴和一个时间轴 - 服务器指标数据、应用程序性能监控数据、网络数据等也都是时序数据
Prometheus可以做什么?
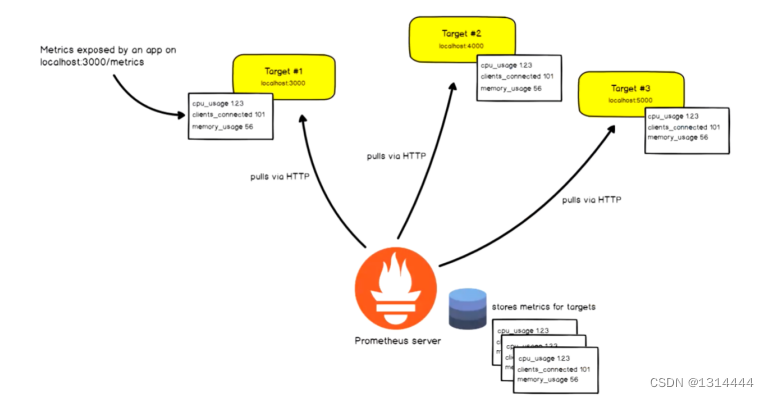
- 基于HTTP call,从配置文件中指定的网络端点(endpoint)上周期性获取指标数据
Prometheus特点
- 多维数据模型:由度量名称和键值对标识的时间序列数据
- PromQL:一种灵活的查询语言,可以利用多维数据完成复杂的查询
- 不依赖分布式存储,单个服务器节点可直接工作
- 基于HTTP的pull方式采集时间序列数据
- 通过PushGateway组件支持推送时间序列数据
- 通过服务或静态配置发现目标
- 多种图形模式及仪表盘支持
Prometheus组件及架构
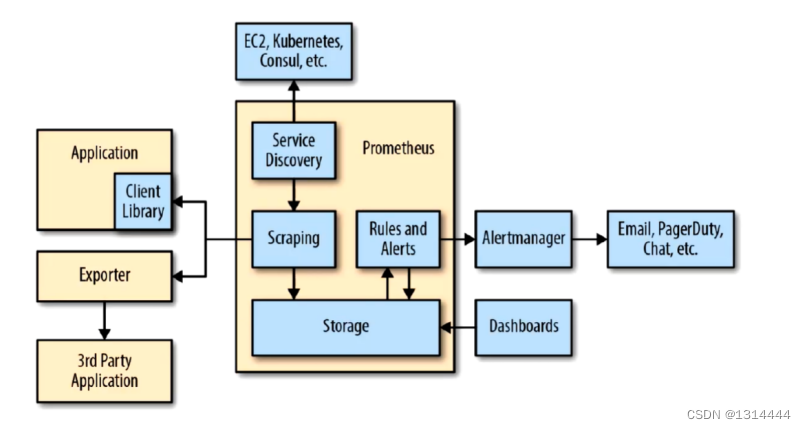
Prometheus如何工作的
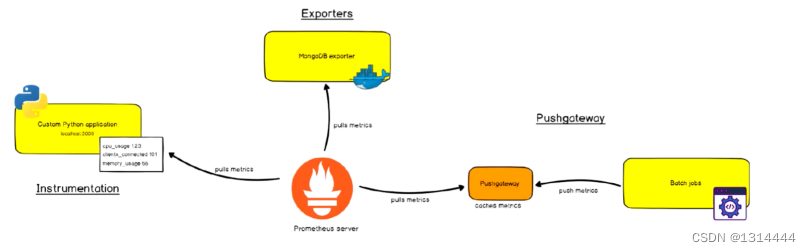
- Prometheus支持通过三种类型的途径从目标上“抓取(Scrape)”指标数据
- Exporters
- Instrumentation
- Pushgateway
Prometheus生态组件
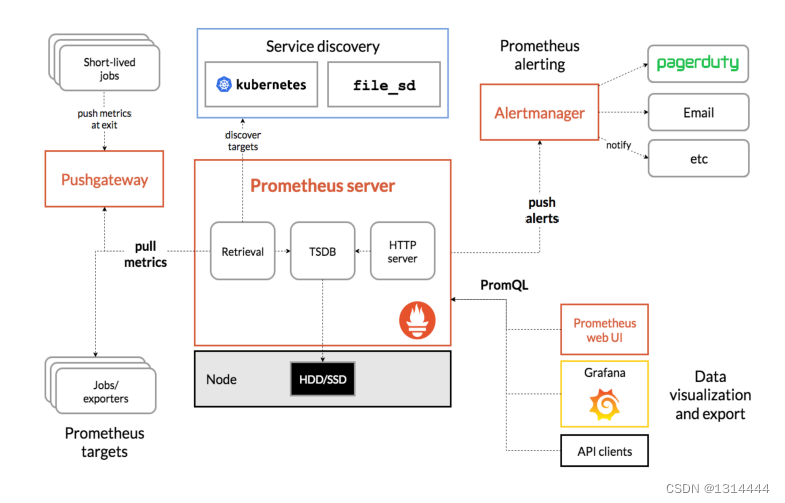
- Prometheus Server:收集指标和存储时间序列数据,并提供查询接口
- ClientLibrary:客户端库,目的在于为那些期望原生提供Instrumentation功能的应用程序提供便捷的开发途径
- Push Gateway:接收那些通常由短期作业生成的指标数据网关,并支持由Prometheus Server进行指标拉取操作
- Exporters:用于暴露现有应用程序或服务(不支持Instrumentation)的指标给Prometheus Server
- Alertmanager:从Prometheus Server接收到“告警通知”后,通过去重,去组,路由等预处理功能后以高效向用户完成告警信息发送
- Data Visualization:Prometheus Web UI(Prometheus Server内建),及Grafana等
- Service Discovery:动态发现待监控的Target,从而完成监控配置的重要组件,在容器化环境中尤为有用,该组件目前由Prometheus Server内建支持
- Web UI:简单的WEB控制台,表达式浏览器
Pull and Push
- Prometheus同其他TSDB相比有一个非常典型的特性:它主动从各Target(目标主机)上“拉取(Pull)”数据,而非等待被监控端的”推送(Push)“
- 两个方式各有优劣,其中,Pull模型的优势在于:
- 集中控制:有利于将配置集中在Prometheus Server上完成,包括指标及采取速率等
- Prometheus的根本目标在于收集在 Target 上预先完成聚合的聚合型数据,而非一款由事件驱动的存储系统
指标类型(Metric Types)
Prometheus使用4种方法来描述监视的指标
- Counter :计数器,用于保存单调递增型的数据,例如站点访问次数等,不能为负值,也不支持减少,但可以重置为0
- Gauge :仪表盘,用于存储有着起伏特征的指标数据,例如内存空闲大小等
- Gauge 是 Counter 的超集,但存在指标数据丢失的可能性时,Counter能让用户确切了解指标随时间的变化状态,而Gauge则可能随时间流逝而精准度越来越低
- Histogram :直方图,它会在一段时间范围内对数据进行采样,并将其计入可配置的bucket中,Histogram能够存储更多的信息,包括样本值分布在每个bucket(bucket自身的可配置)中的数量,所有样本值之和以及总的样本数量,从而Prometheus能够使用内置的函数进行如下操作:
- 计算样本平均值:以值得总和除以值得数量
- 计算样本分位值:分位数有助于了解符合特定标准得数据个数,如评估响应时长超过1秒钟的请求比例,若超过20%即发送告警等
- Summary :摘要,Histogram的扩展类型,但它是直接由被检测端自行聚合计算出分位数,并将计算结果响应给Prometheus Server的样本采集请求,因而,其分位数计算是由监控端完成
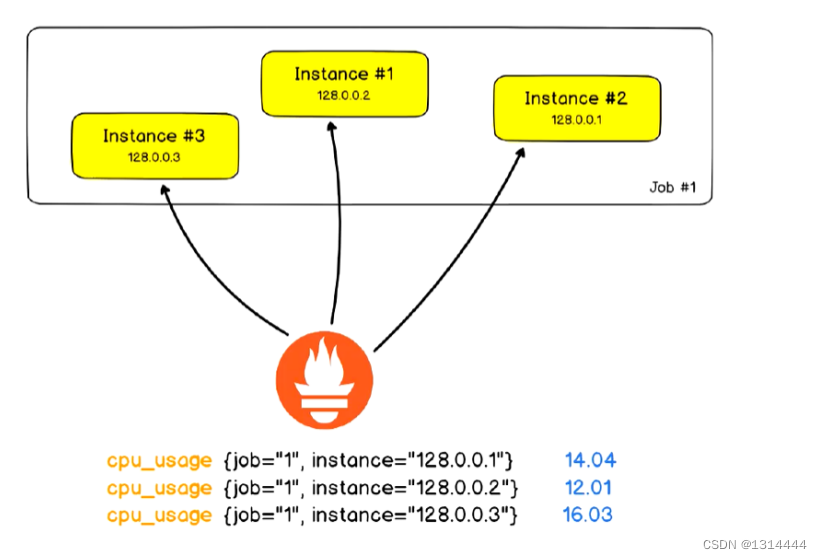
作业(Job)和实例(Instance)
nstance:能够接收Prometheus Server数据Scrape操作的每个网络端点( endpoint ),即为一
个 Instance (实例),类似 target- 通常,具有类似功能的 Instance 的集合称为一个
Job,例如一个MySQL主从复制集群中的所有
MySQL进程可以称为一个 Job
局限性
- Prometheus是一款指标监控系统,不适合存储事件及日志等,更多的是展示趋势性的监控,而非精
准数据 - Prometheus认为只有最近的监控数据才有查询的需要,其本地存储的设计初衷只是保存短期(如一个月)数据,因而不支持针对大量的历史数据进行存储
- 若需要存储长期的历史数据,建议基于远端存储机制将数据保存于InfluxDB或OpenTSDB等系统中
- Prometheus及集群机制成熟度不高,即便基于Thanos亦是如此
部署并运行Prometheus
部署Prometheus
二进制部署
- 下载预制的程序包
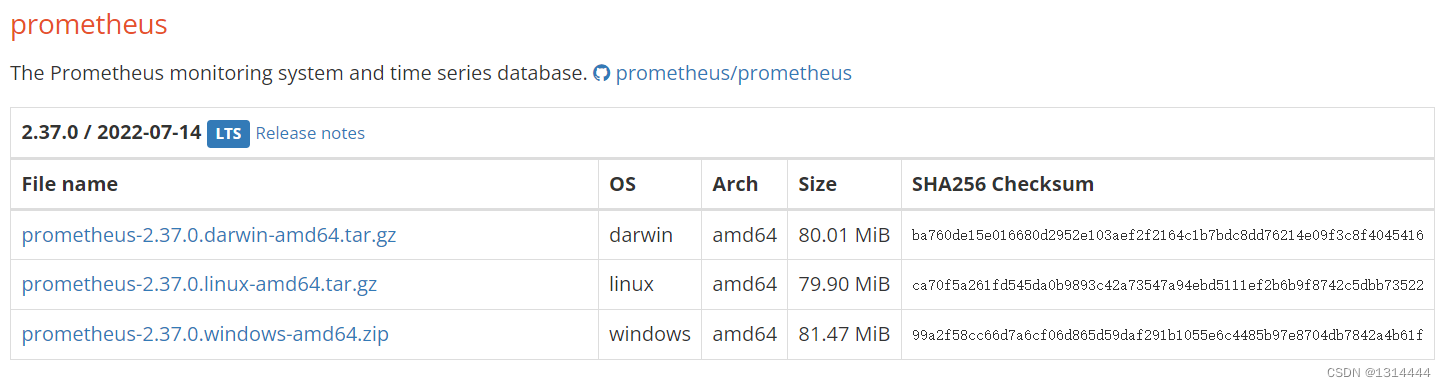
$ tar zxf prometheus-2.25.2.linux-amd64.tar.gz -C /usr/local
$ cd /usr/local && ln -sv prometheus-2.25.2.linux-amd64 prometheus
运行Prometheus
二进制启动
$ cd /usr/local/prometheus && ./prometheus
配置为系统服务管理
$ cat > /usr/lib/systemd/system/prometheus.service << EOF
[Unit]
Description=prometheus
[Service]
ExecStart=/opt/prometheus/prometheus --config.file=/opt/prometheus/prometheus.yml
ExecReload=/bin/kill -HUP \$MAINPID
KillMode=process
Restart=on-failure
[Install]
WantedBy=multi-user.target
EOF
Prometheus配置
配置文件详解
# my global config
global:
scrape_interval: 15s # Set the scrape interval to every 15 seconds. Default is
every 1 minute.
evaluation_interval: 15s # Evaluate rules every 15 seconds. The default is every 1
minute.
# scrape_timeout is set to the global default (10s).
# Alertmanager configuration
alerting:
alertmanagers:
- static_configs:
- targets:
# - alertmanager:9093
# Load rules once and periodically evaluate them according to the global
'evaluation_interval'.
rule_files:
# - "first_rules.yml"
# - "second_rules.yml"
# A scrape configuration containing exactly one endpoint to scrape:
# Here it's Prometheus itself.
scrape_configs:
# The job name is added as a label `job=<job_name>` to any timeseries scraped from
this config.
- job_name: 'prometheus'
# metrics_path defaults to '/metrics'
# scheme defaults to 'http'.
static_configs:
- targets: ['localhost:9090']
| 参数 | 说明 |
|---|---|
| scrape_interval | 采集数据时间间隔 |
| evaluation_interval | 评估告警规则时间间隔,默认是1分钟 |
| scrape_timeout | 采集数据超时时间,默认10秒 |
| rule_files | 指定告警规则文件 |
| scrape_configs | 配置被监控端,称为target,每个target使用job_name分组管理 |
| alerting | 配置告警服务端 |
参考文档:https://prometheus.io/docs/prometheus/latest/configuration/configuration/
Prometheus常用选项
| 选项 | 说明 |
|---|---|
| –config.file “/path/to/prometheus.yml” | 指定prometheus.yml配置文件路径 |
| –storage.tsdb.path “/path/to/data” | 指定监控指标数据存储的路径 |
| –storage.tsdb.retention=15d | 历史数据最大保留时间,默认15天 |
| –web.console.templates=“/path/to/consoles” | 指定控制台模板目录路径 |
| –web.console.libraries=“/path/to/consoles_libraries” | 指定控制台库目录路径 |
| –web.max-connections=512 | 设置最大同时连接数 |
| –web.external-url “http://{ip或域名}:9090” | 用于生成返回prometheus的相对和绝对链接地址, 可以在后续告警通知内容中直接点击链接地址访问Prometheus Web UI |
| –web.listen-address “0.0.0.0:9090” | Prometheus默认监控端口 |
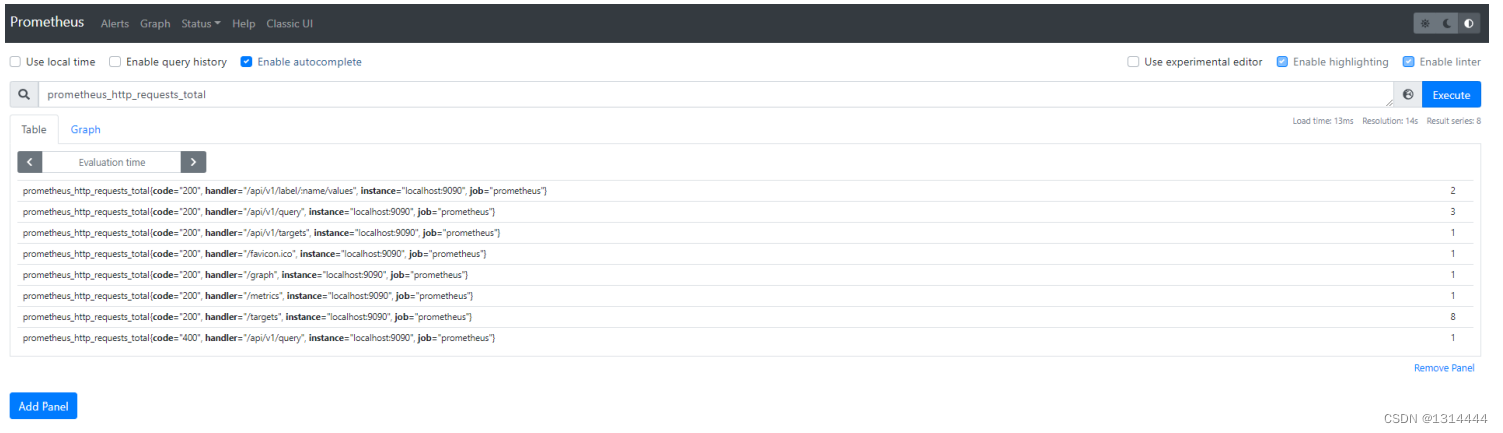
相关概念
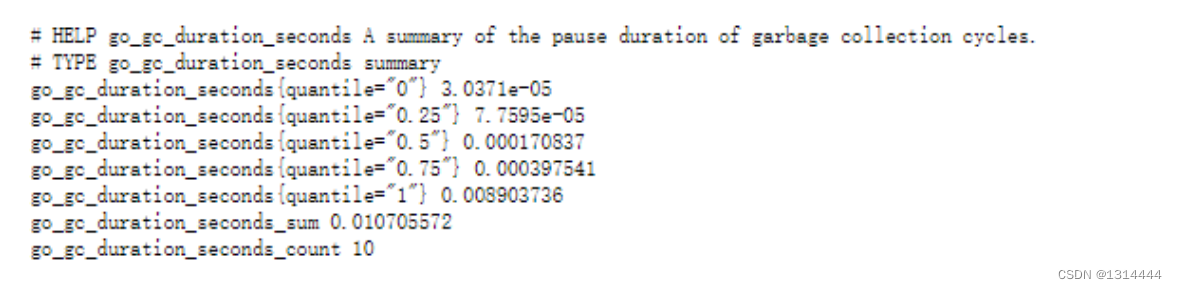
指标格式:
<metric name>{<label name>=<label value>, ...} [metric value] [time]
添加被监控端
- 安装node_exporter
$ tar zxf node_exporter-1.1.2.linux-amd64.tar.gz -C /usr/local
$ ln -sv node_exporter-1.1.2.linux-amd64 node_exporter
- 配置为系统服务管理
$ cat > /usr/lib/systemd/system/node_exporter.service << EOF
[Unit]
Description=node_exporter
Documentation=https://prometheus.io/
After=network-online.target
[Service]
Type=simple
ExecStart=/opt/node_exporter/node_exporter
ExecReload=/bin/kill -HUP \$MAINPID
KillMode=process
Restart=on-failure
[Install]
WantedBy=multi-user.target
EOF
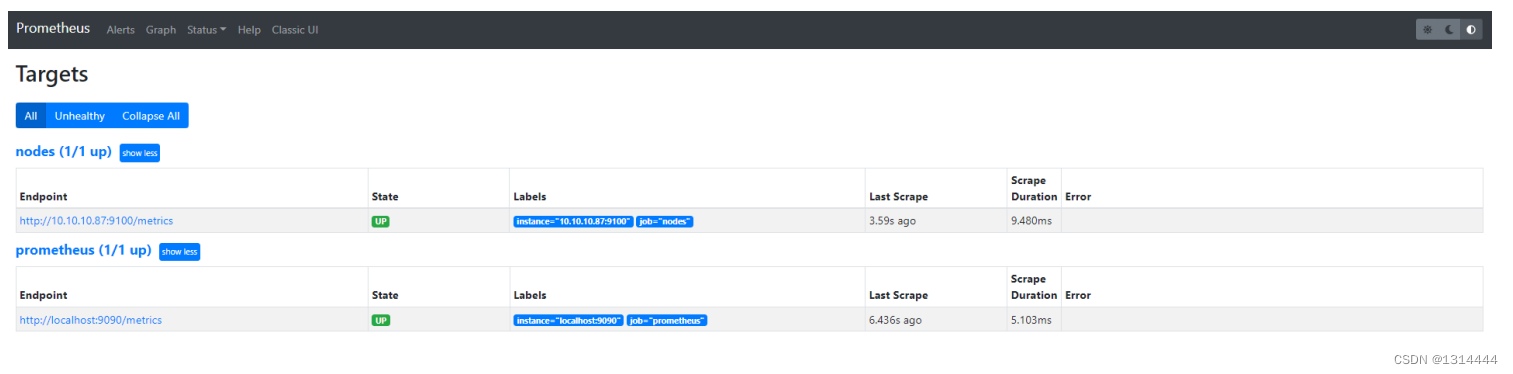
- 修改Prometheus Server配置文件
$ vim prometheus.yml
...
scrape_configs:
- job_name: 'prometheus'
static_configs:
- targets: ['localhost:9090']
- job_name: 'nodes'
static_configs:
- targets:
- '10.10.10.87:9100'

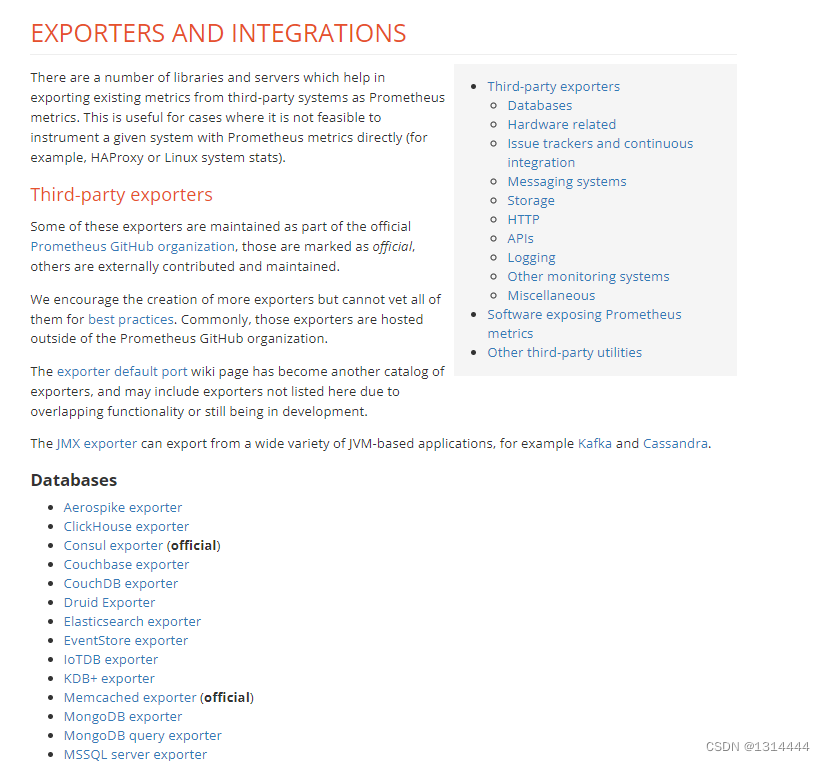
exporters
- exporter下载地址:https://prometheus.io/docs/instrumenting/exporters/
监控示例
安装并运行cadvisor
- 使用二进制部署
$ wget https://github.com/google/cadvisor/releases/download/v0.41.0/cadvisor
$ ./cadvisor -port=8080 &>> /var/log/cadvisor.log
- 使用docker部署
$ docker pull google/cadvisor:latest
$ docker run -d \
-v /:/rootfs:ro \
-v /var/run:/var/run:rw \
-v /sys:/sys:ro \
-v /var/lib/docker/:/var/lib/docker:ro \
-p 8080:8080 \
--detach=true \
--name cadvisor \
google/cadvisor:latest
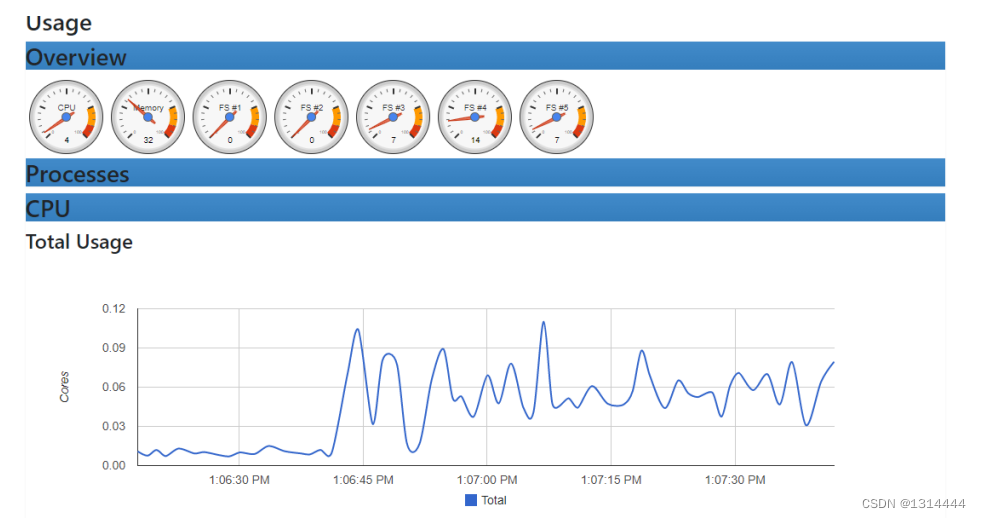
Grafana可视化
部署并运行Grafana
- yum安装
$ vim /etc/yum.repos.d/grafana.repo
[grafana]
name=grafana
baseurl=https://mirrors.tuna.tsinghua.edu.cn/grafana/yum/rpm
repo_gpgcheck=0
enabled=1
gpgcheck=0
$ yum makecache
$ yum install grafana
$ systemctl start grafana-server
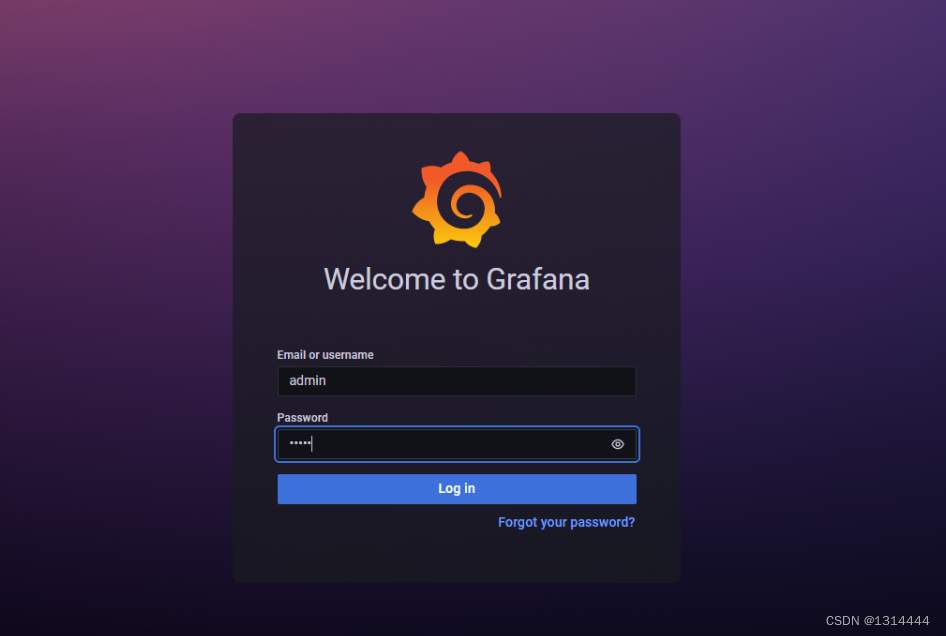
- 访问地址:IP:3000
- 初始账户密码:admin/admin
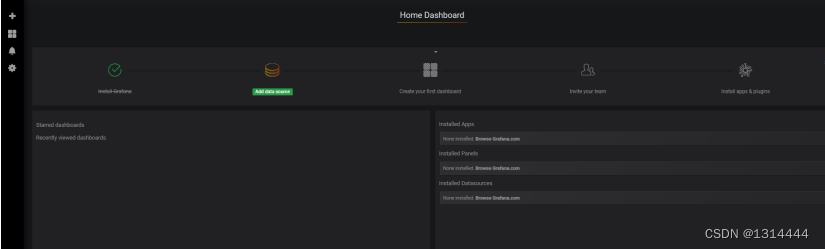
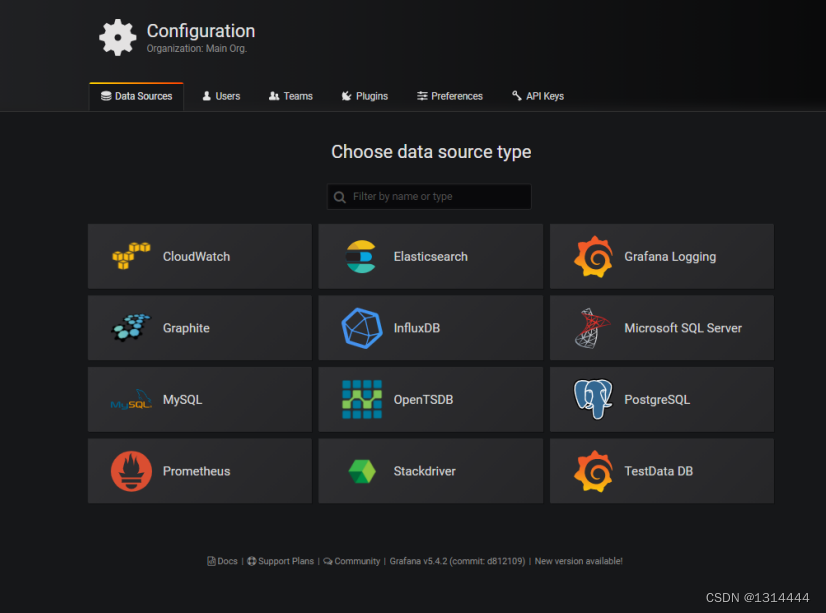
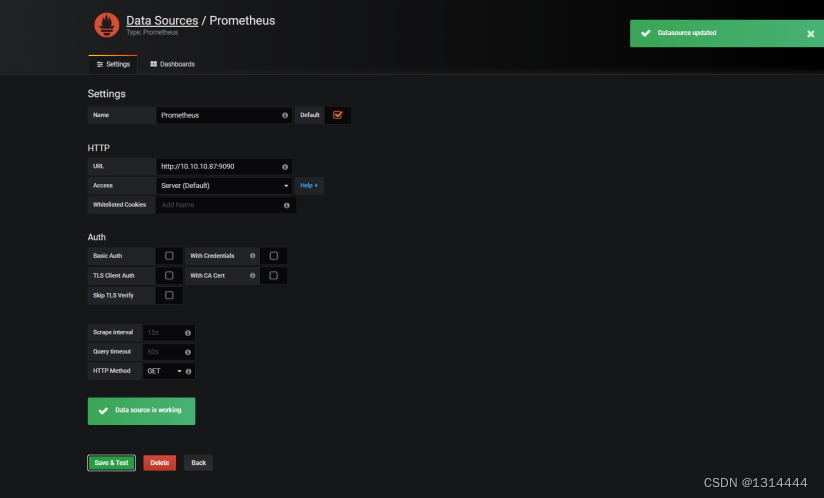
添加数据源
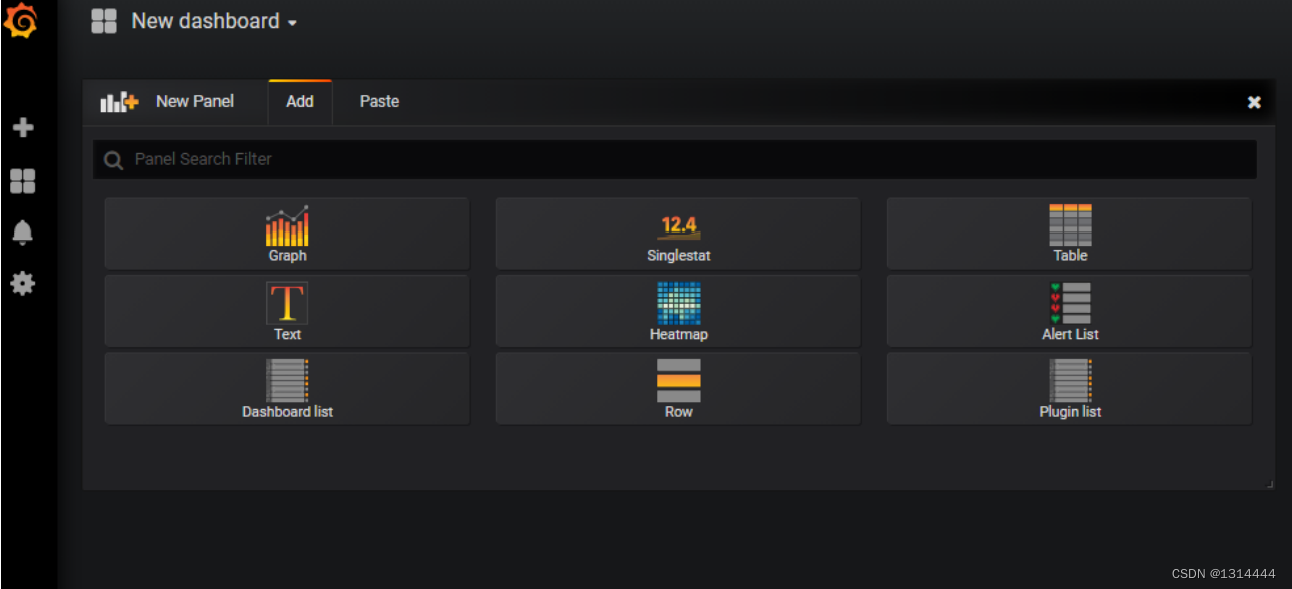
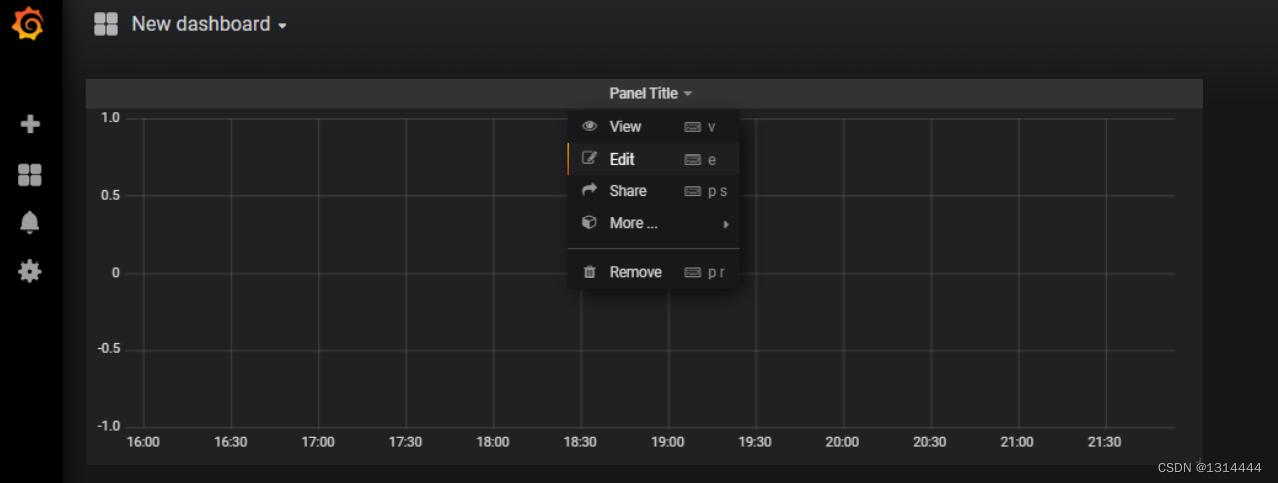
添加Dashboard
设置导航栏
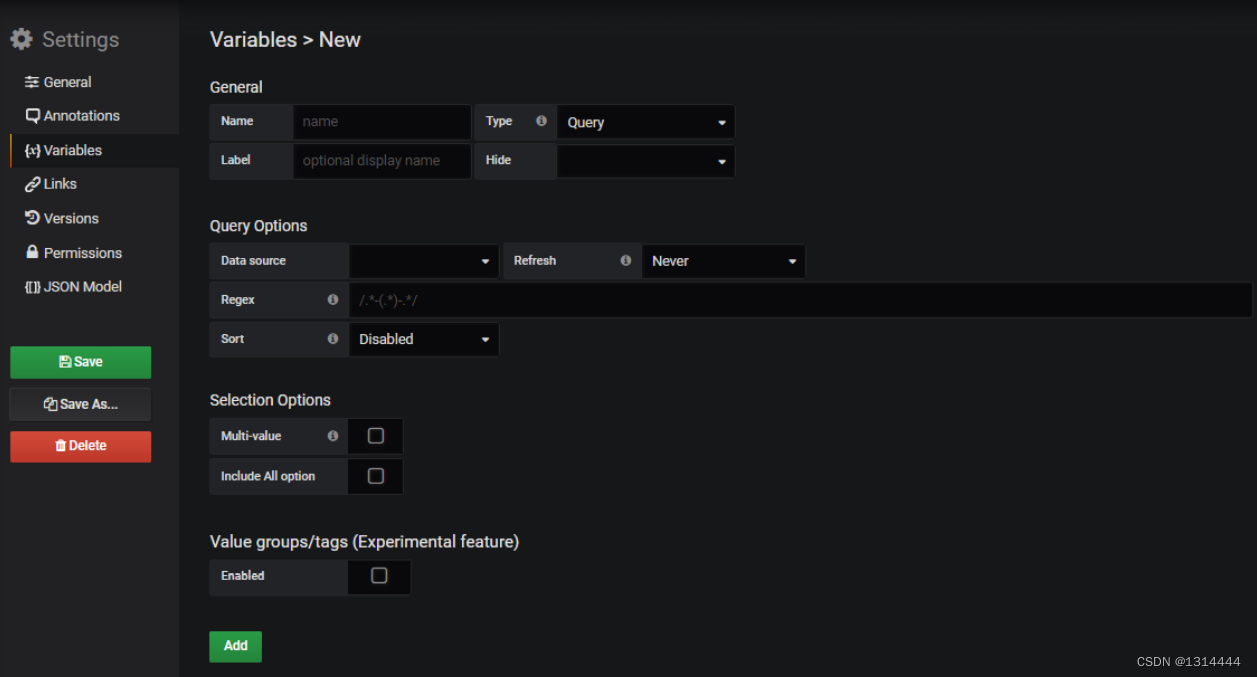
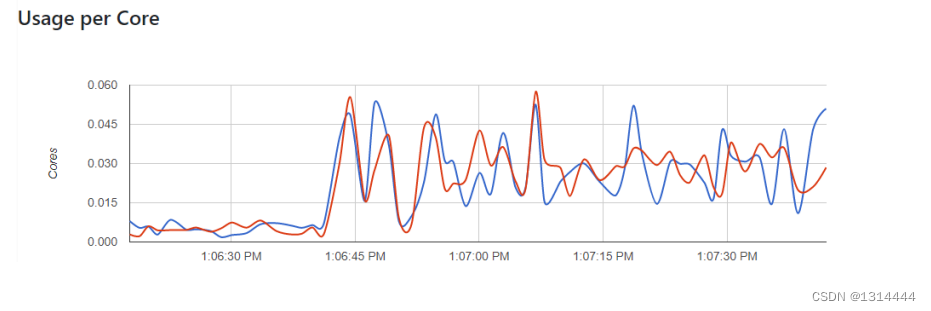
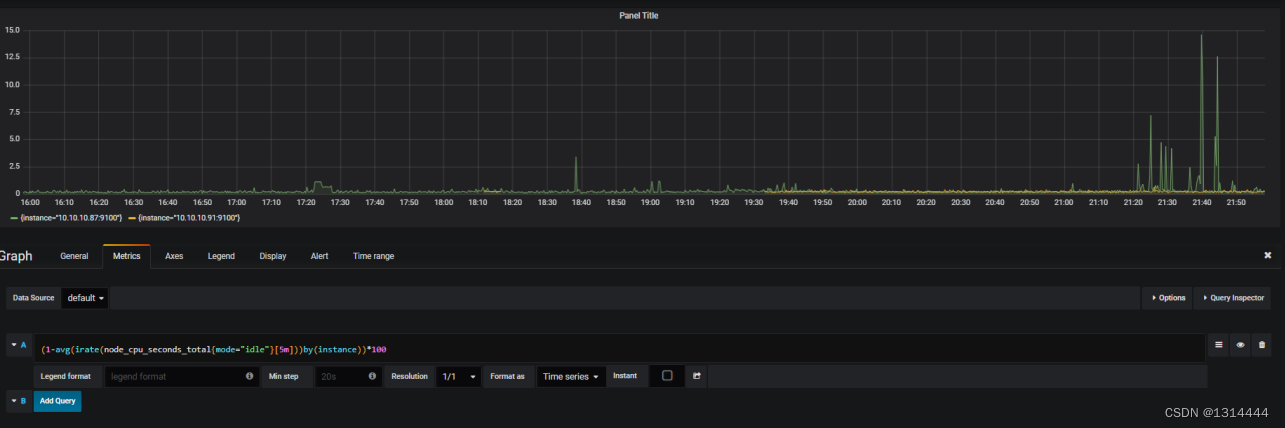
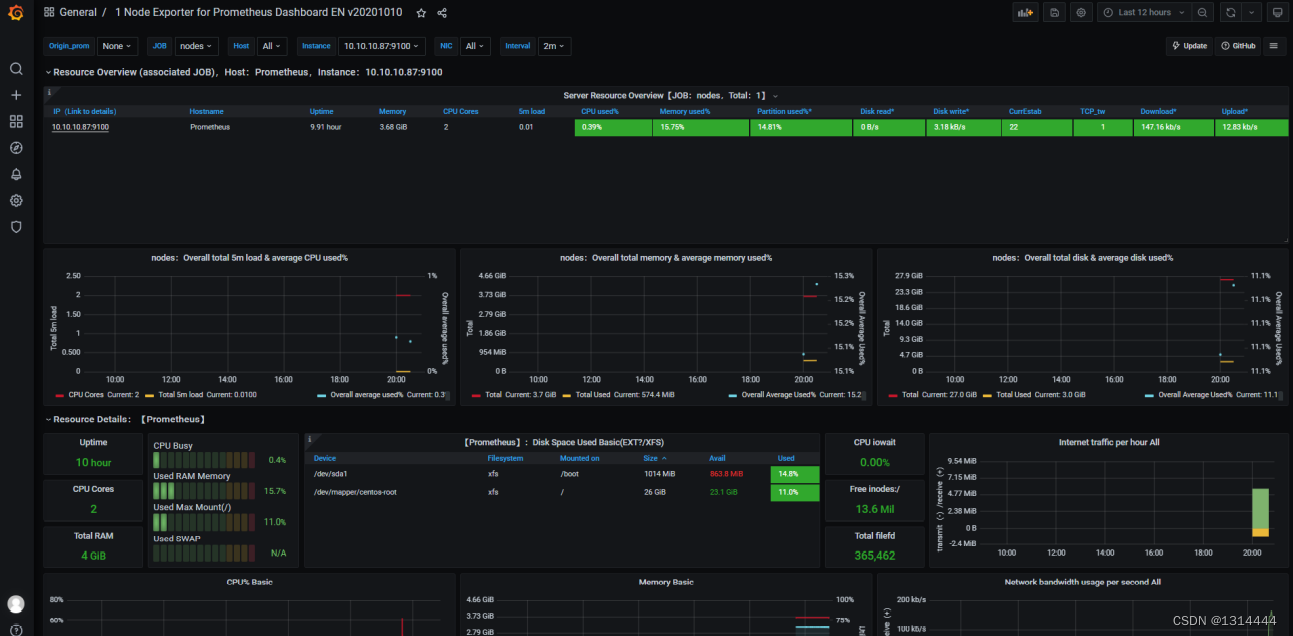
自定义监控仪表

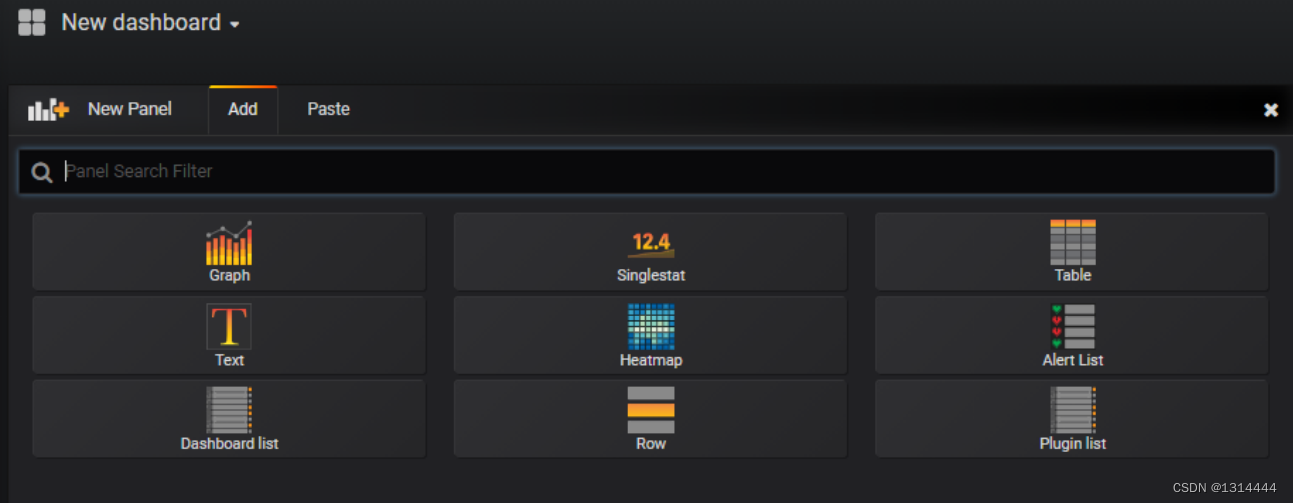
仪表盘类型
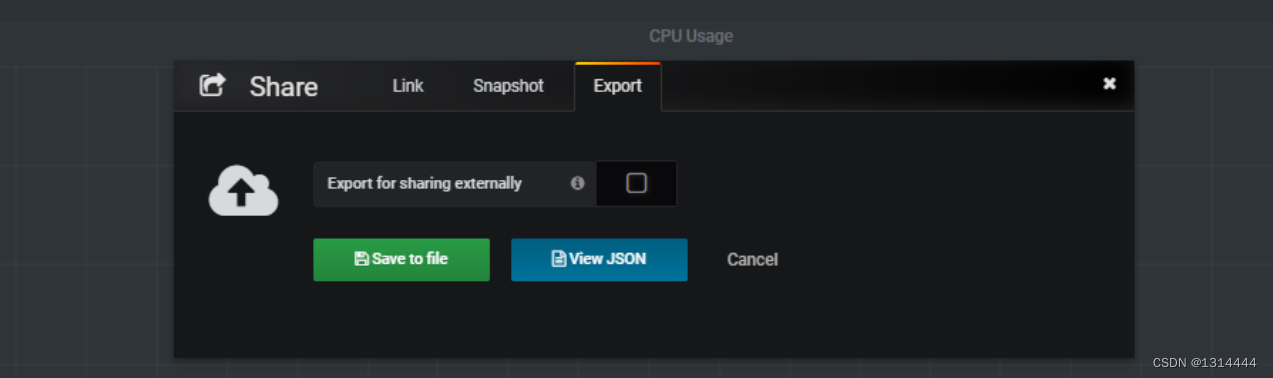
仪表盘导出分享
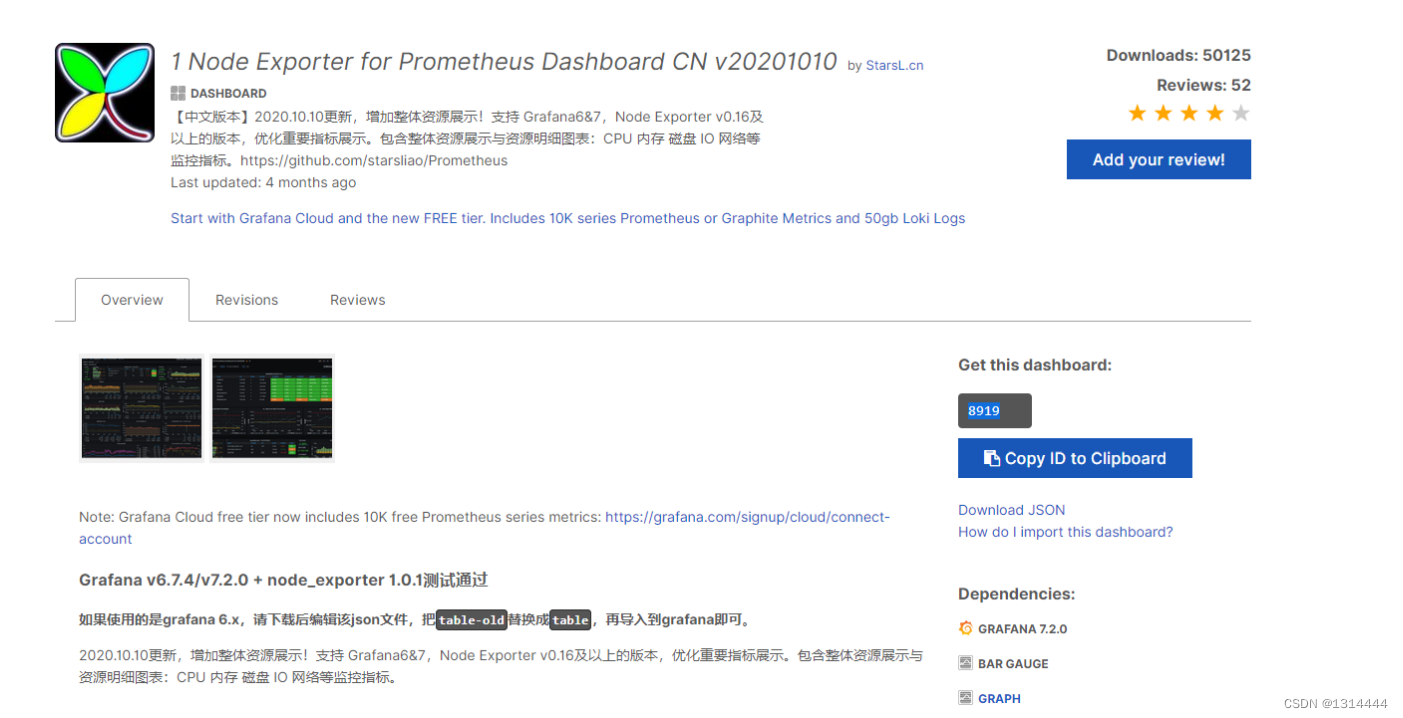
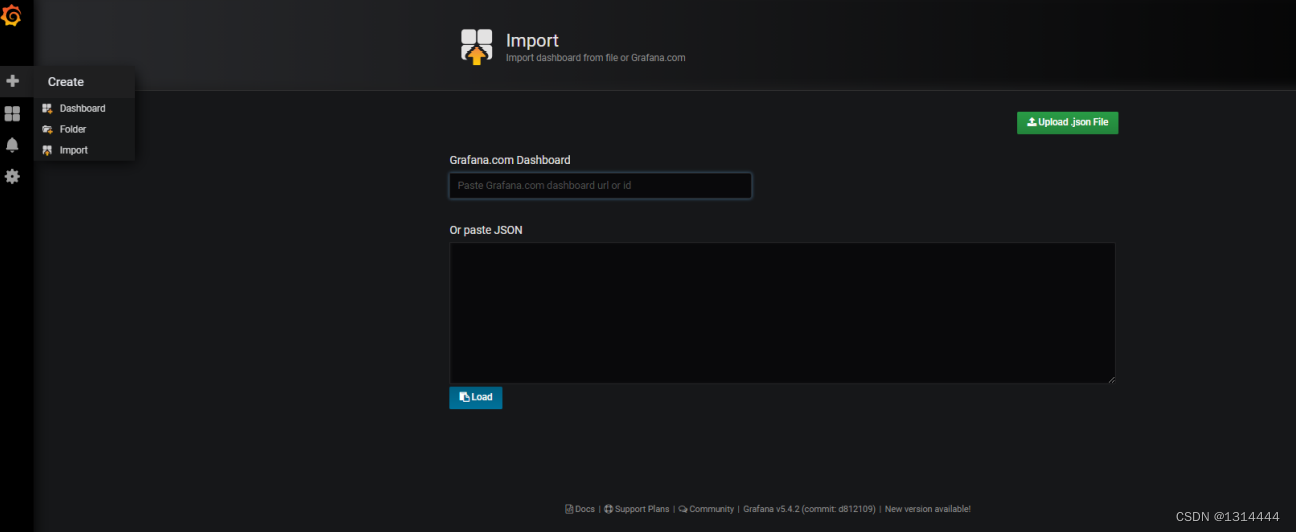
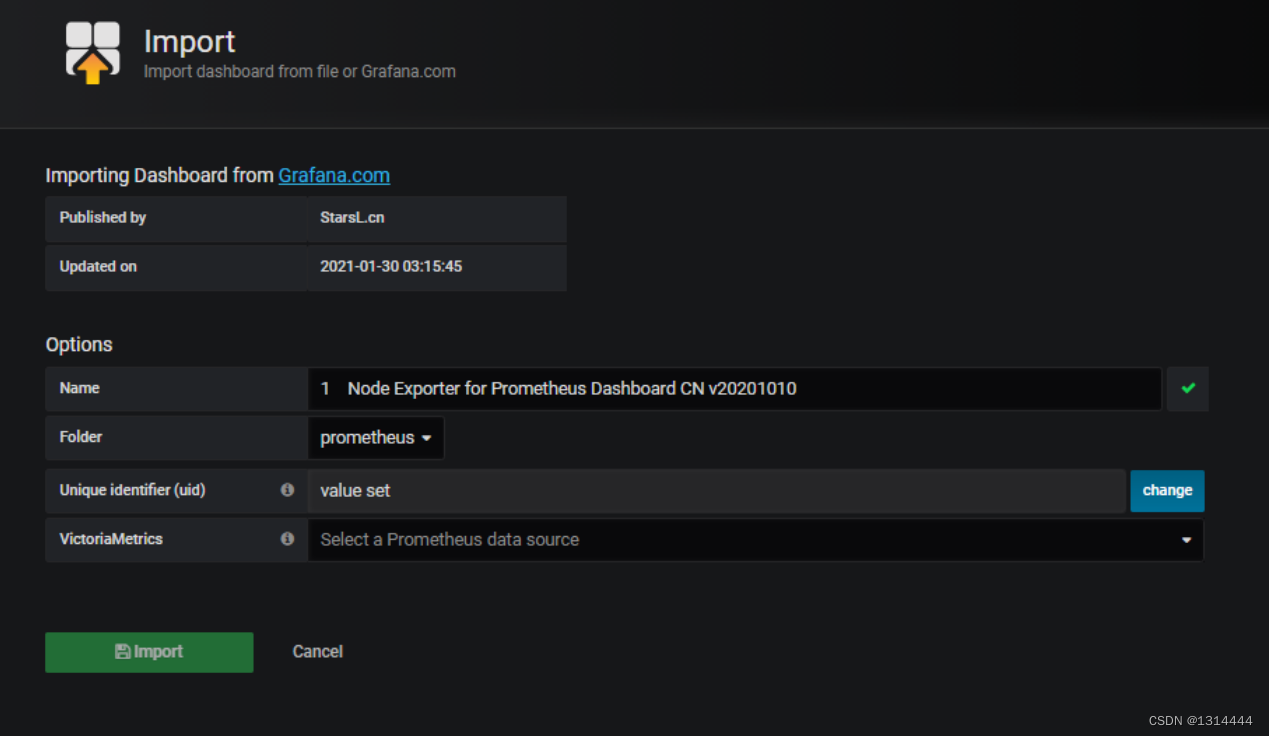
导入仪表盘模板
-
搜索相应的数据源
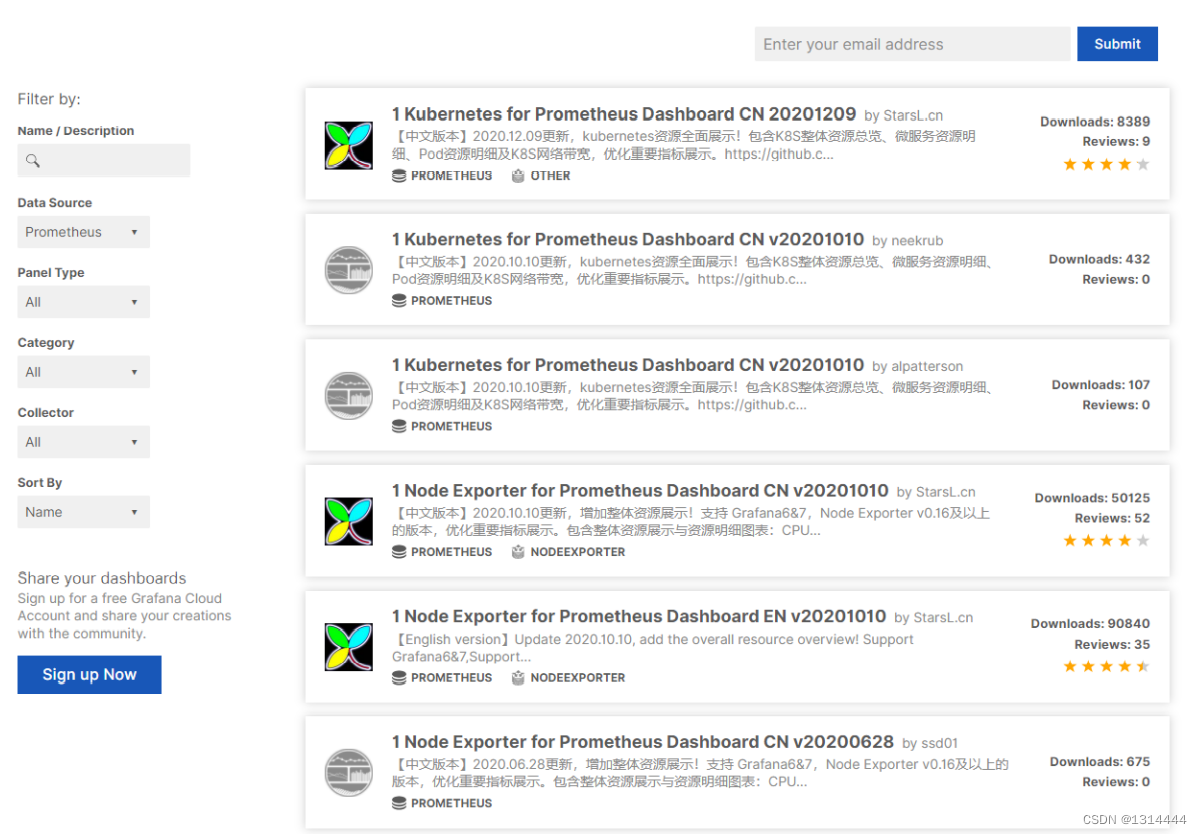
-
拷贝相应编号
-
导入grafana

开源、云原生的融合云平台
更多推荐
 0
0 0
0- 0


 已为社区贡献3条内容

所有评论(0)